VIP
  • Reports
  • Data Catalogue
  • Weekly Analysis
  • Frontier

On this page

  • Building
  • Identifying Compounds
    • Double Checking Clusters
  • Concerns
    • Building Data
    • Clustering Algorithm

Counting Compounds

Author

Simon Taye

Published

July 22, 2025

Abstract

An exploration of counting the number of compounds using satellite-based building data

This document shows how we could potentially count the number of compounds.

  1. I use survey GPS points to identify the boundaries of town.
  2. Identify all building structures that fall in that community from Facebook’s Open Buildings data
  3. Using distance-based clustering to identify a group of structures as a compound

For this test / example, I will focus on the community: DIMABI NO. 2

Code
```{python}
# | warning: false
satellite = base_plot()
# Adjust layout
satellite.update_layout(
    mapbox=dict(
        center=dict(
            lat=dimabi["centroid_lat"].mean(), lon=dimabi["centroid_lon"].mean()
        )
    ),
)

satellite_static = plotly_to_static_display(satellite)
satellite_static
```

Let us overlay the town boundary and survey points

Code
```{python}
survey = map_areas.plot_community_alpha_shapes(dimabi_survey, dimabi, satellite=True)
survey.update_layout(
    mapbox=dict(
        center=dict(
            lat=dimabi["centroid_lat"].mean(), lon=dimabi["centroid_lon"].mean()
        ),
        zoom=16,
    ),
)
plotly_to_static_display(survey)
```

Building

We can now overlay building data from Facebook:

Code
```{python}
gdf = process_building_data.load_building_data()
```
Code
```{python}
dimabi_building_gdf = process_building_data.subset_buildings(
    gdf, dimabi.iloc[0]["geometry"], buffer_size=0.0001
)
```
Code
```{python}
survey = map_areas.plot_community_alpha_shapes(dimabi_survey, dimabi, satellite=True)
survey.update_layout(
    mapbox=dict(
        center=dict(
            lat=dimabi["centroid_lat"].mean(), lon=dimabi["centroid_lon"].mean()
        ),
        zoom=16,
    ),
)
plotly_to_static_display(add_buildings_to_plot(survey, dimabi_building_gdf))
```
/var/folders/rj/c4rjx52d217gsm3ccfx5q20r0000gr/T/ipykernel_90254/3387420824.py:93: DeprecationWarning:

*scattermapbox* is deprecated! Use *scattermap* instead. Learn more at: https://plotly.com/python/mapbox-to-maplibre/

Identifying Compounds

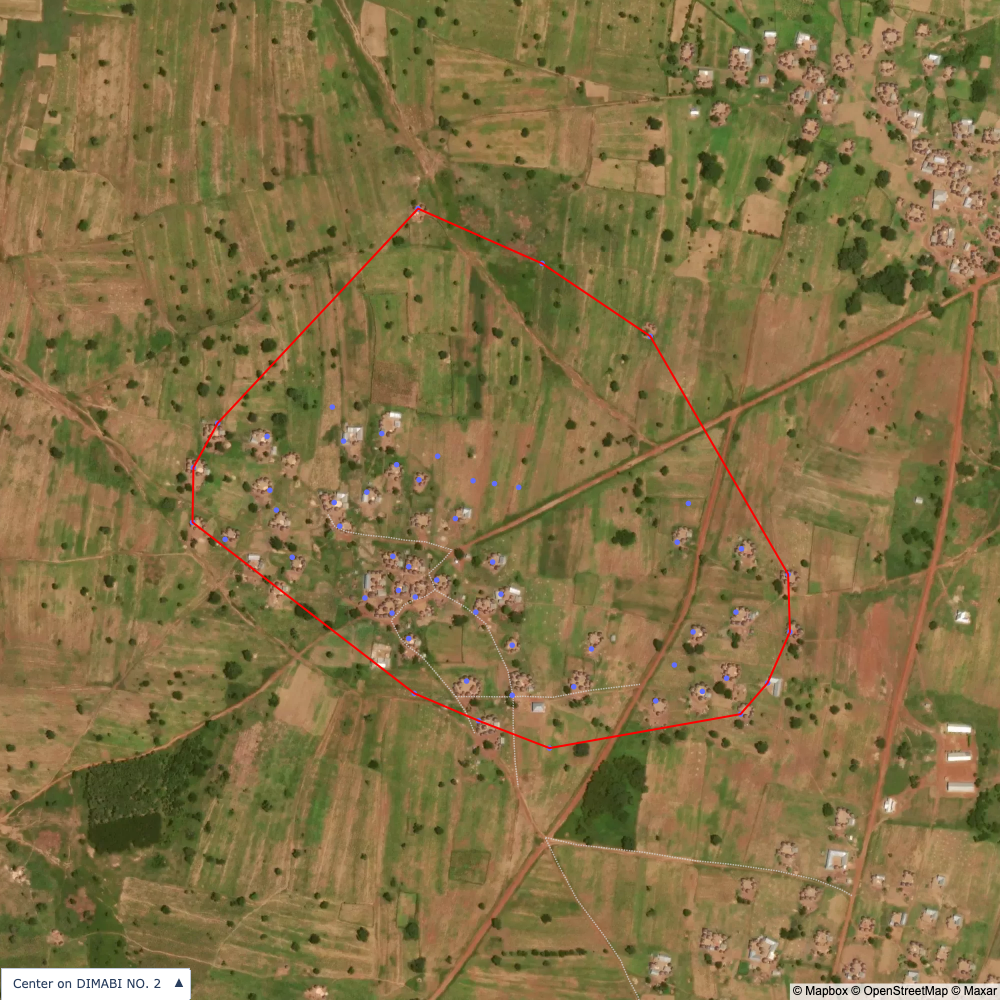
Finally, we can apply various clustering algorithms to group structures into compounds. However, there is no obvious threshold for what is a compound and what isn’t. Visually, the cluster in the middle from DIMABI NO. 2 is difficult to identify as a single or multiple compounds or where the boundaries for the compounds would be.

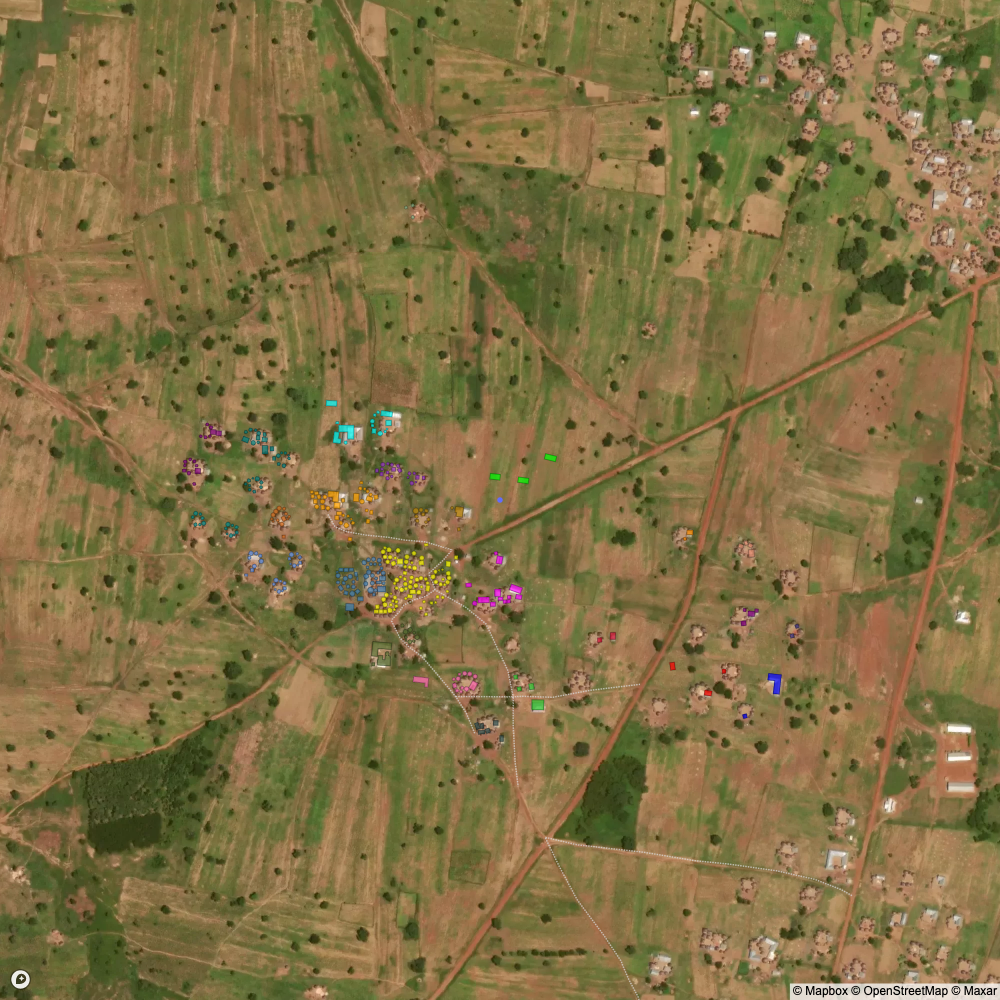
I used a clustering with a distance parameter set by “eye” (i.e. arbitrarily) to define what a compound should be. The result is visible below and closely matches what I would have done manually had I grouped compounds by hand.

Code
```{python}
# | warning: false
# Corresponds to 5m (from Claude)
###### An eps of 0.00005 degrees would translate to approximately:
###### 0.00005 × 111,320 meters ≈ 5.57 meters (about 18.3 feet)
dimabi_building_gdf.loc[:, f"h_labels"] = cluster.cluster_hierarchical_average(
    dimabi_building_gdf, distance_threshold=0.00054
)
```
Code
```{python}
# | warning: false
fig = visualize_clusters(dimabi_building_gdf, "h_labels")
cluster_pic = plotly_to_static_display(fig)
fig
```

Double Checking Clusters

Code
```{python}
cluster_pic
```

```{python}
satellite_static
```

Concerns

Building Data

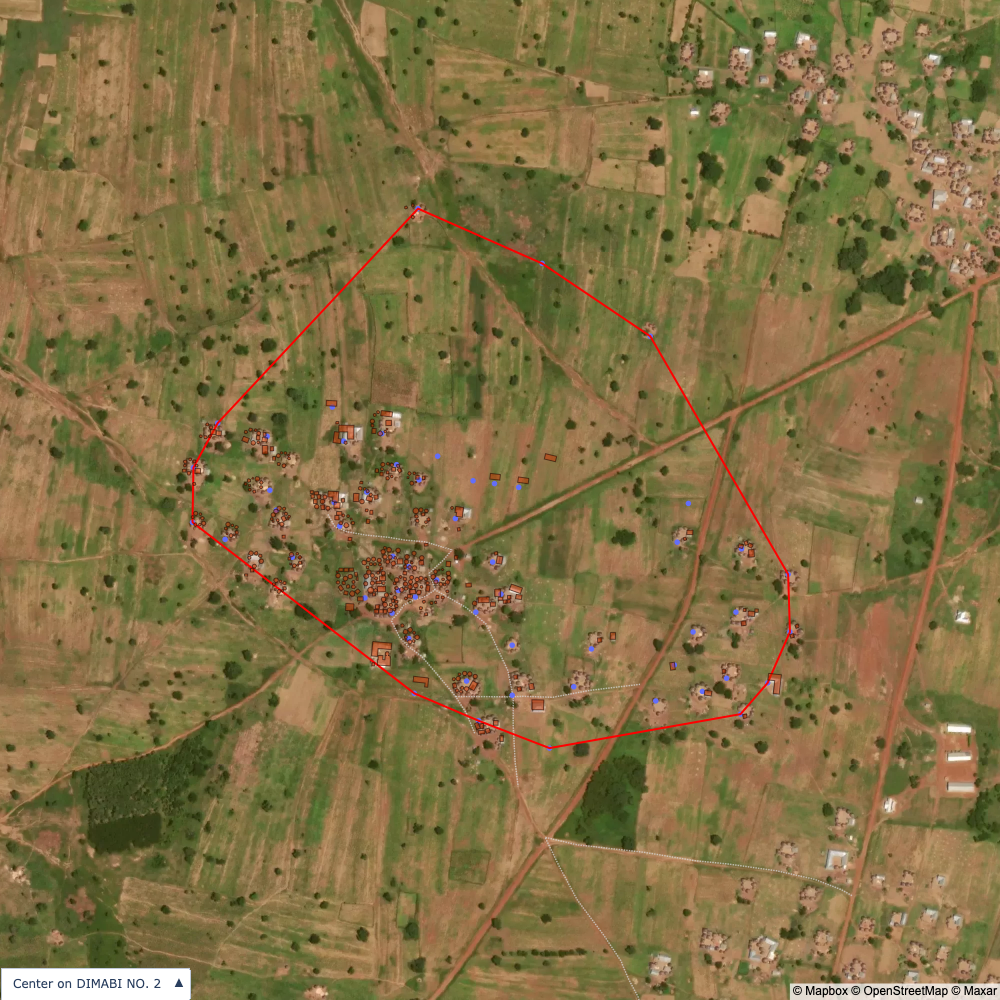
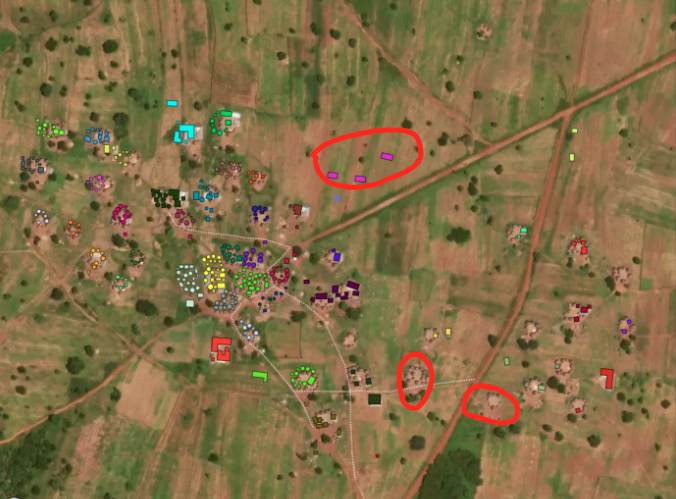
I do not know how up-to date / accurate building data is. It seems to align with the satellite imagery fairly well but I don’t know enough about the context to make a judgement

Caution

Note the mismatch of the building data and satellite images. They contradict each other and it’s not clear that it would be right to assume one or the other is correct

data inconsistencies

data inconsistencies

Clustering Algorithm

I use agglomerative clustering to group buildings and structures into compounds. The algorithm works by joining individual points (in our case, points are buildings) into clusters.

agglomerative clustering

agglomerative clustering

In our case, unlike the visualization, we terminate the algorithm early once the distance between clusters exceeds some threshold. That is, we would stop at Step 2 or Step 3 — depending on how we set the distance threshold.

I currently have this set at 0.0007 after some trial-and-error but it is somewhat arbitrary. We don’t have any labelled training data to pick the best parameter here nor is it immediately obvious that the parameter should be identical across communities.

Tip

0.0007 degrees is roughly about 78m

Below is a visualization of the clustering algorithm at different distance thresholds; it can also help explain how the clustering works in our context

cluster_animation

cluster_animation
 
Cookie Preferences