Code
```{python}
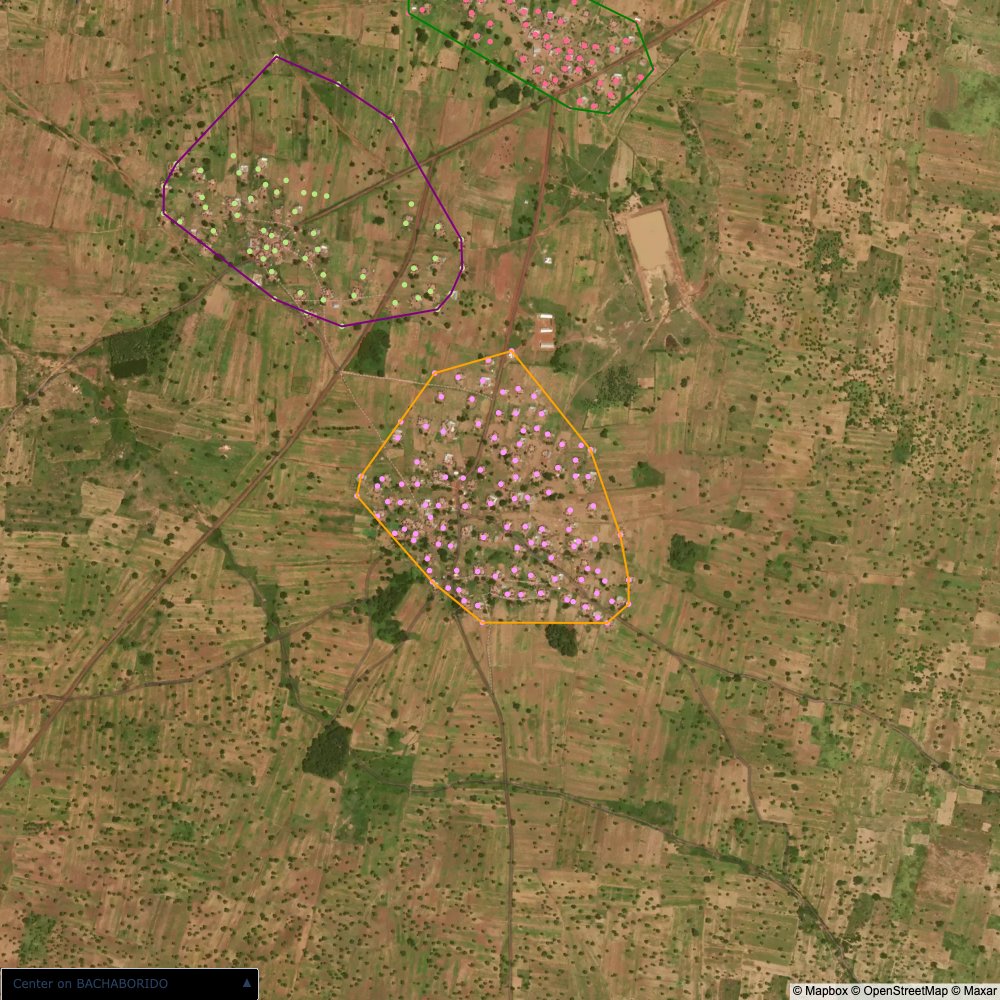
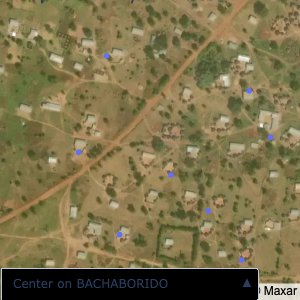
map_areas.plot_community_alpha_shapes(raw_df, raw_gdf)
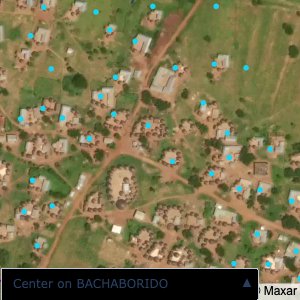
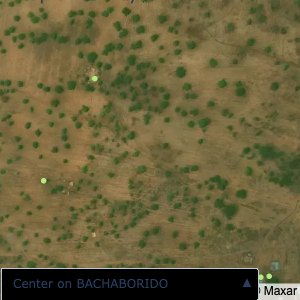
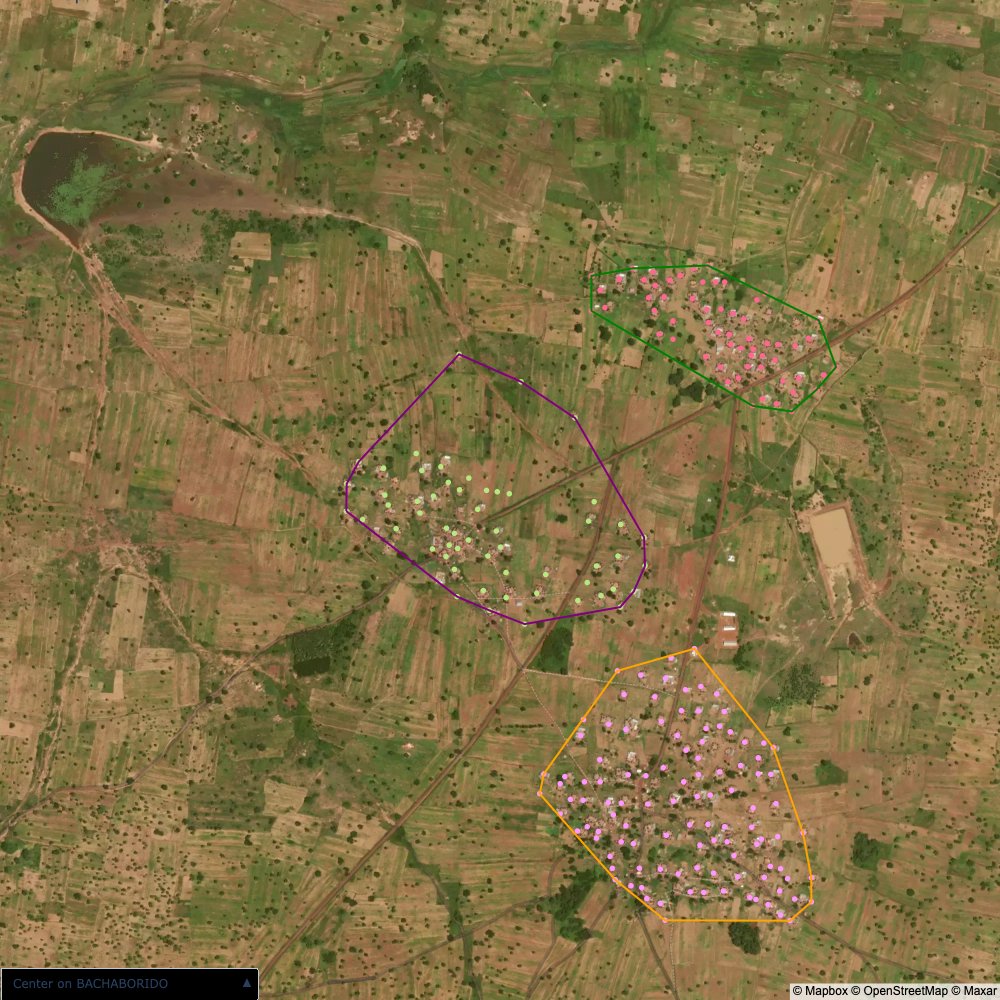
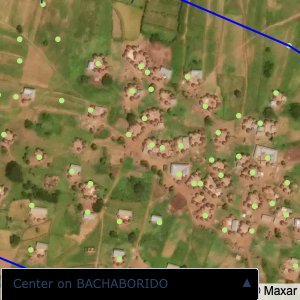
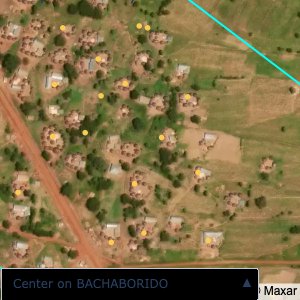
```Plots of the ongoing census sampling to ensure coverage is what we expect
Note that a lot of the communities are mislabelled; a tell-tale sign is that a point within a community is far away from all the other points.
I have corrected all such issues by:
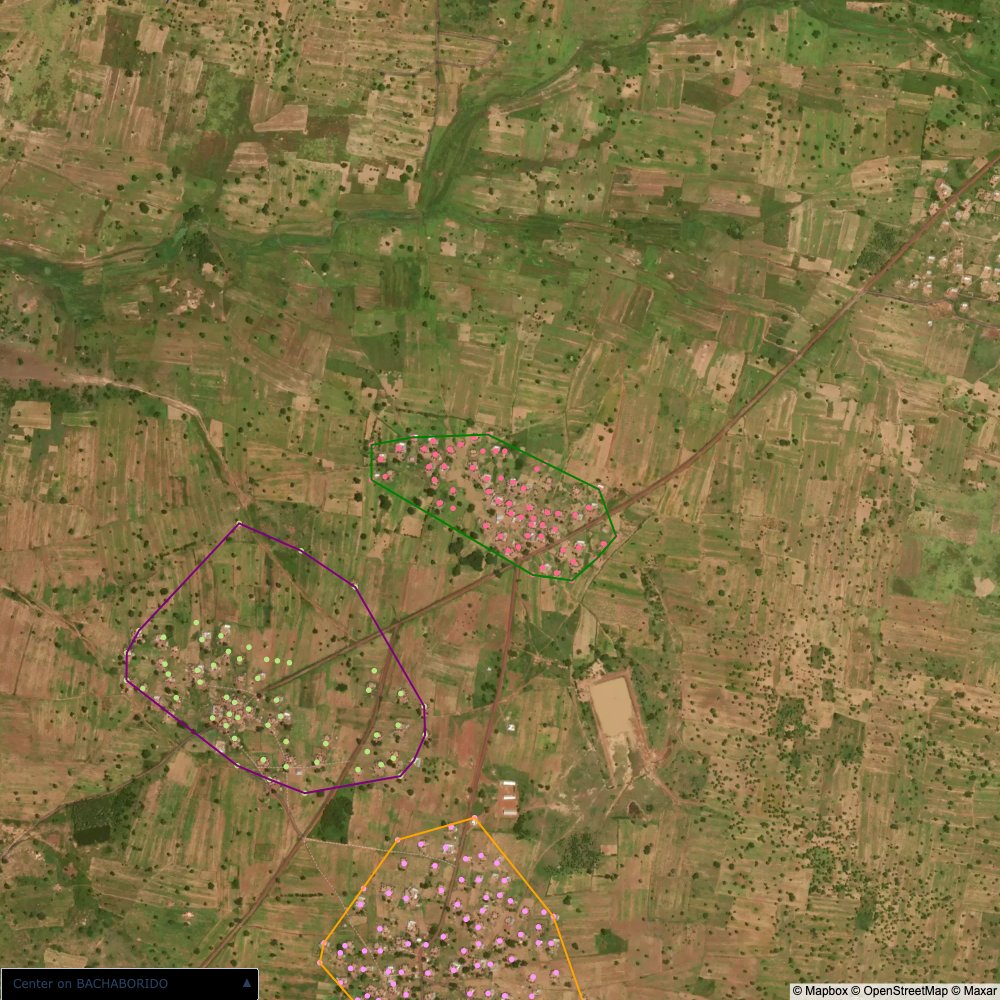
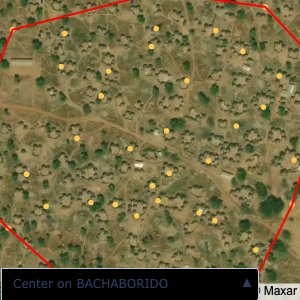
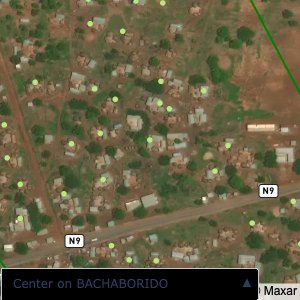
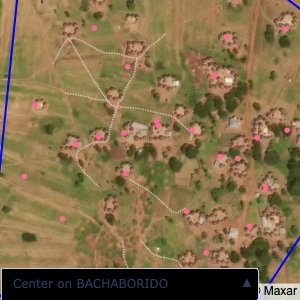
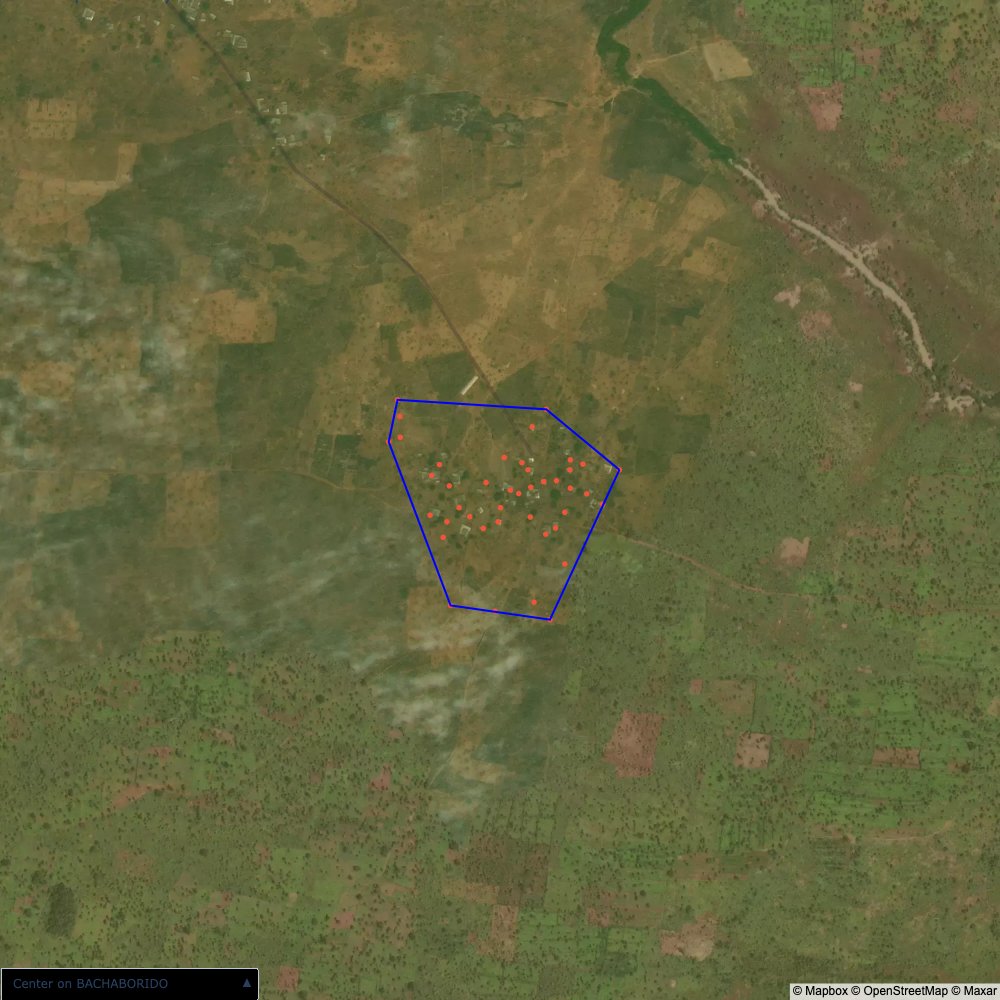
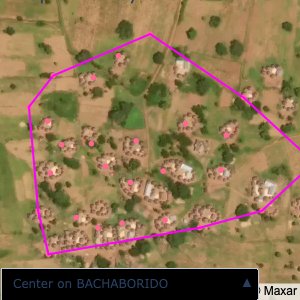
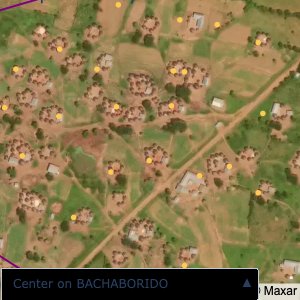
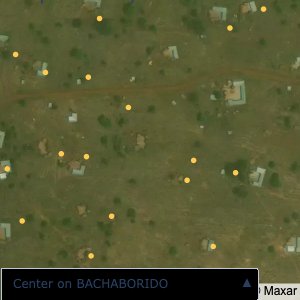
distance of all points within a community from its center and computing the average_distancedistance > (1.5 * avg_distance)The visualizations below show the difference with polygons around all points of community as a rough boundary of the towns
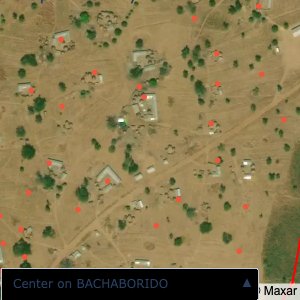
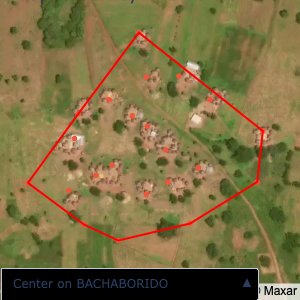
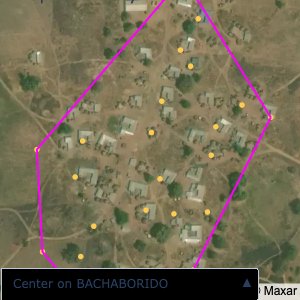
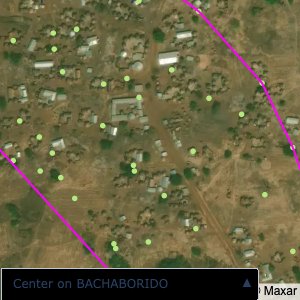
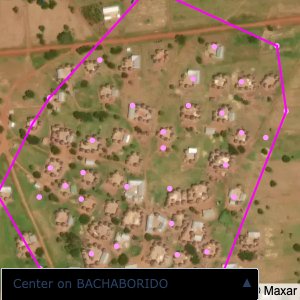
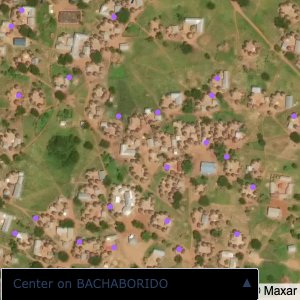
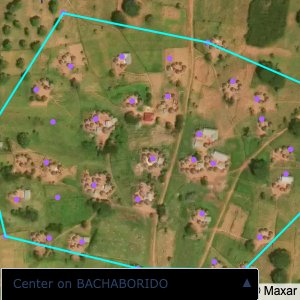
The visualizations below show the points and boundaries around the raw data. Some boundaries span the entire map, showing that points in clearly different places are mislabelled as the same community. Fortunately, it is not too hard to see which points are incorrectly labelled since they are far away from other similarly labelled points. We don’t have any cases where we 2 (or more) large mass of points with the same community label
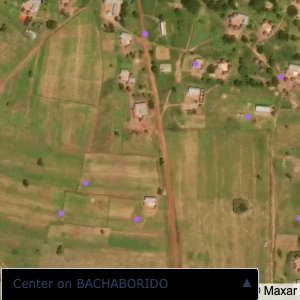
The one (loose) exception is KPALSOGU; however this is because there are two communities with the same name. To solve this problem, I used a simple K-Means algorithm to cluster the points into the two different communities. In the actual data, we would be able to tell them apart by district (the raw GPS data doesn’t have district data causing the confusion)
```{python}
map_areas.plot_community_alpha_shapes(raw_df, raw_gdf)
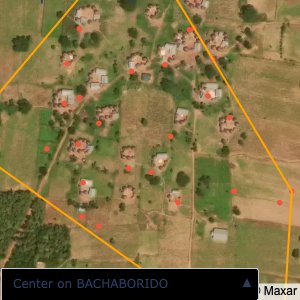
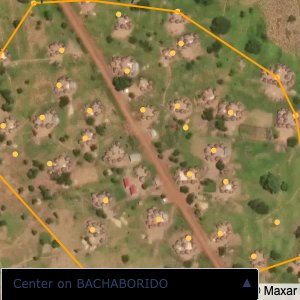
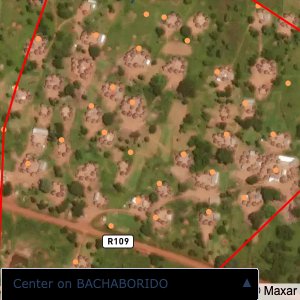
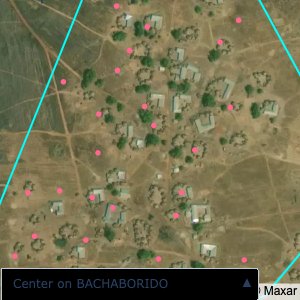
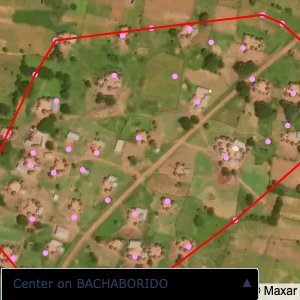
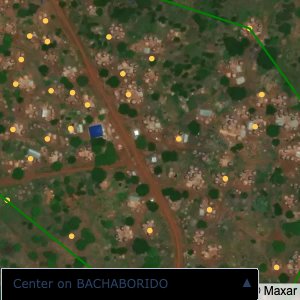
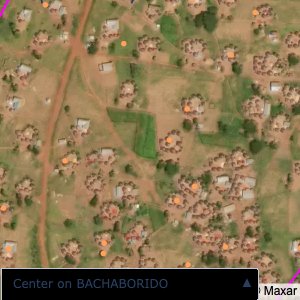
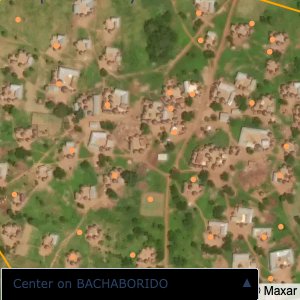
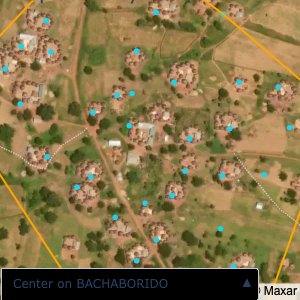
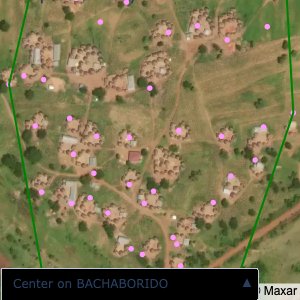
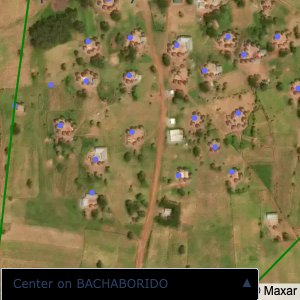
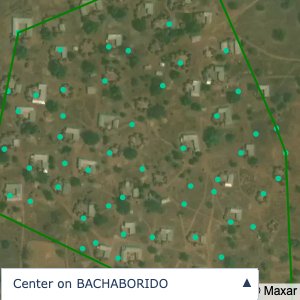
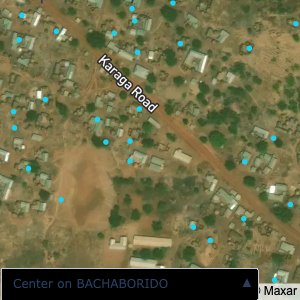
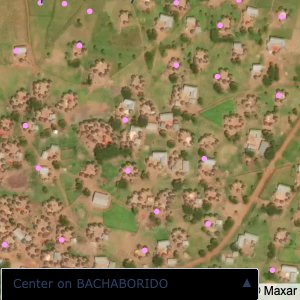
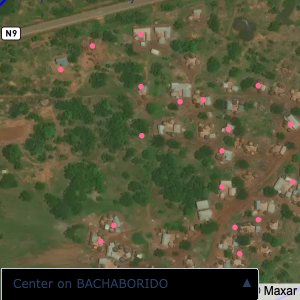
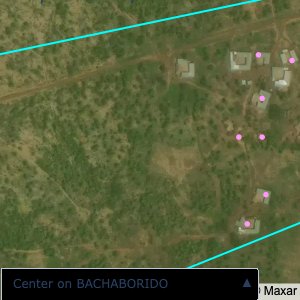
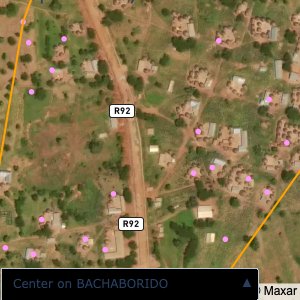
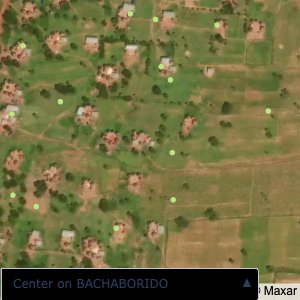
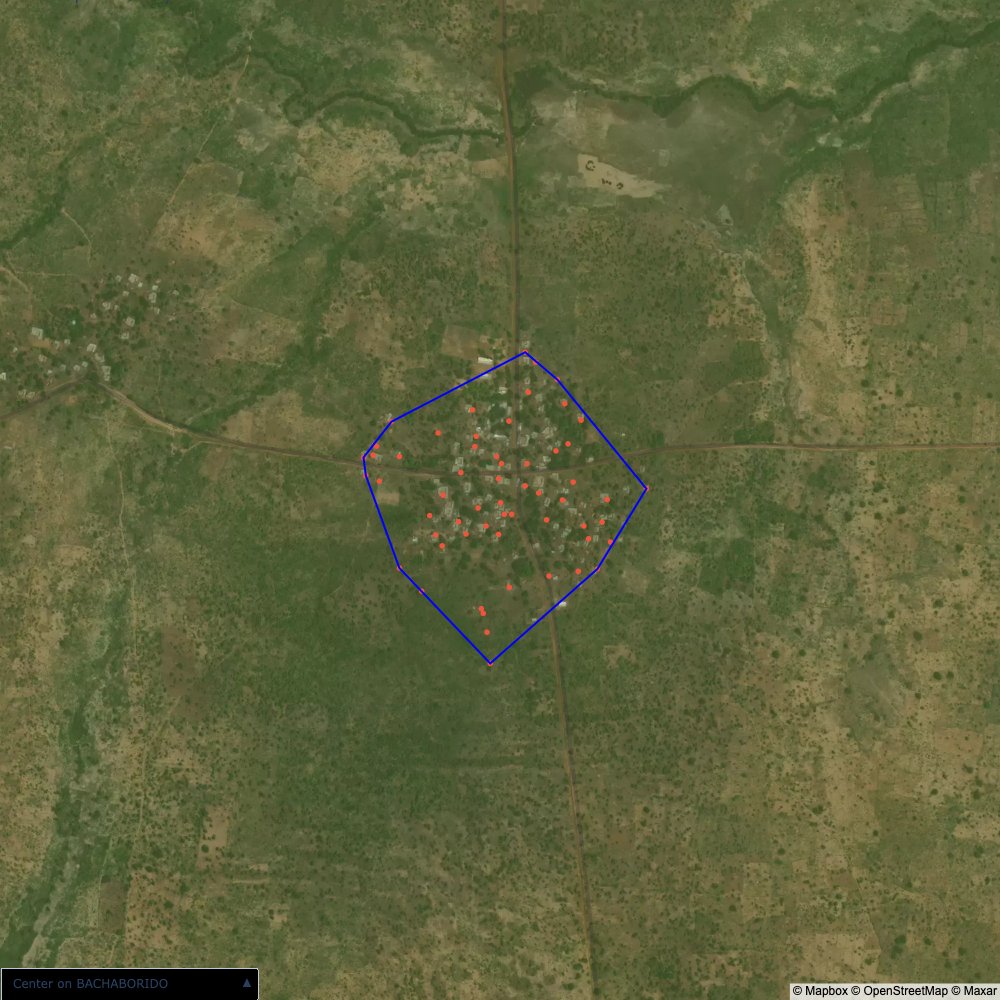
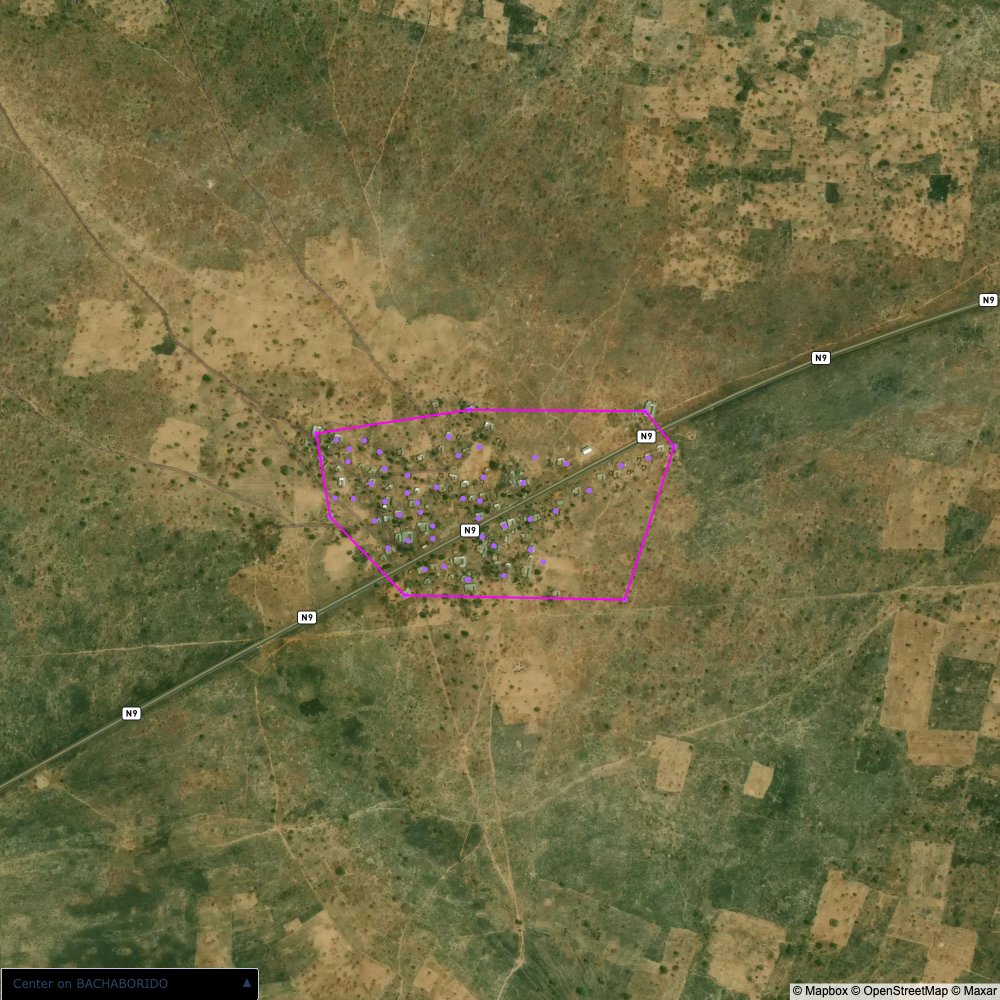
```After running the algorithm, the community boundaries and point locations all look reasonable
```{python}
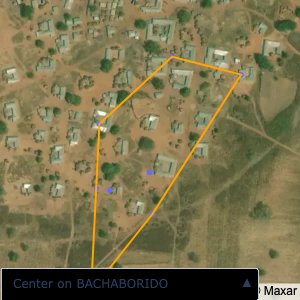
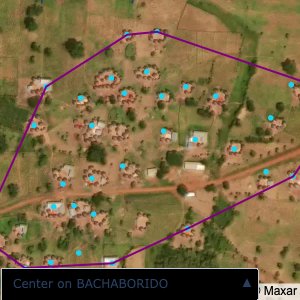
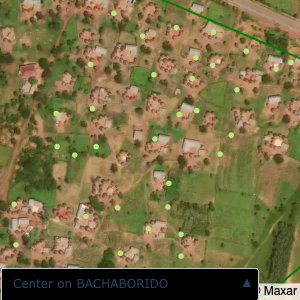
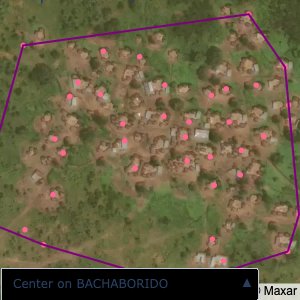
map_areas.plot_community_alpha_shapes(df, gdf)
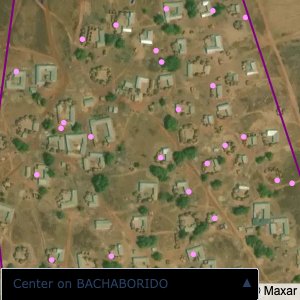
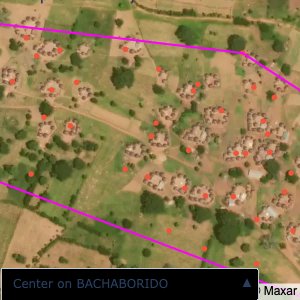
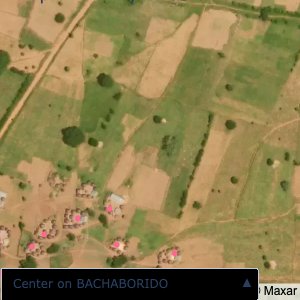
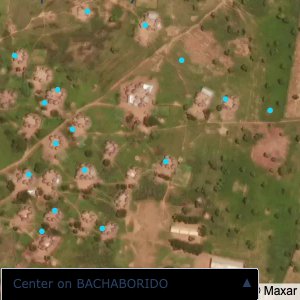
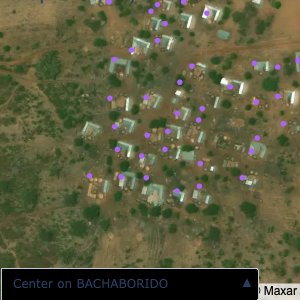
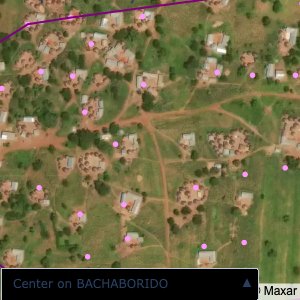
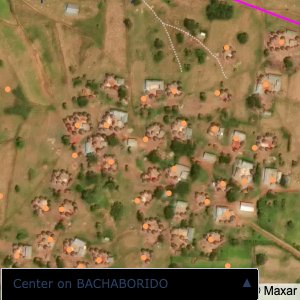
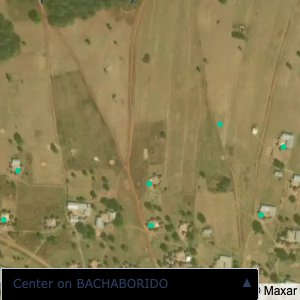
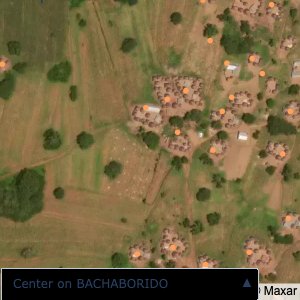
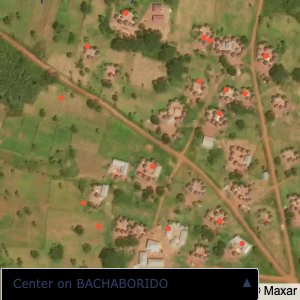
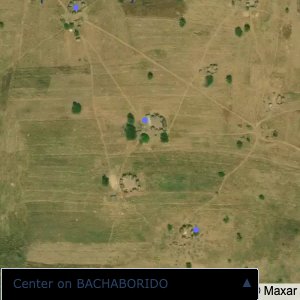
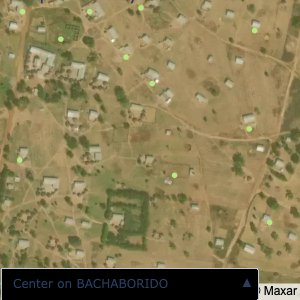
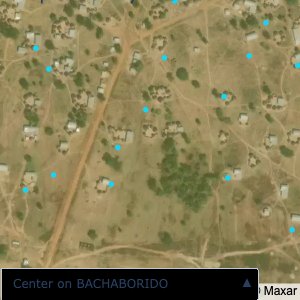
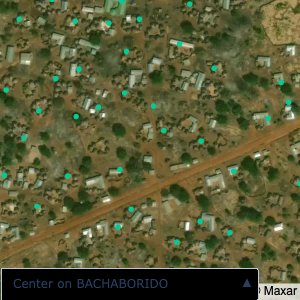
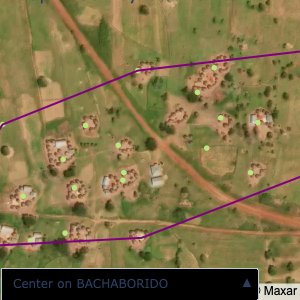
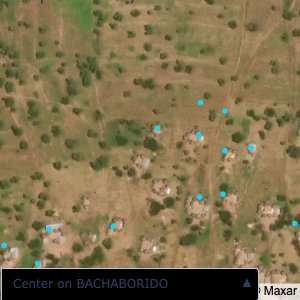
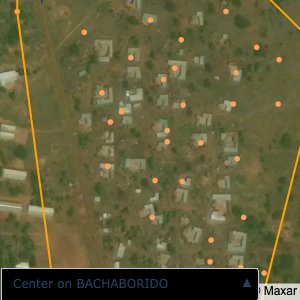
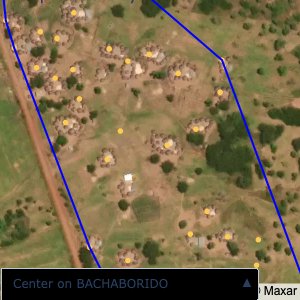
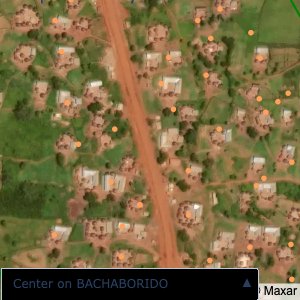
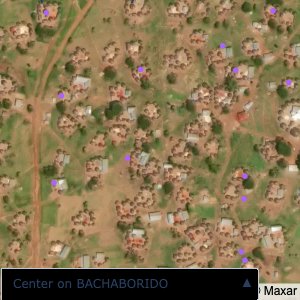
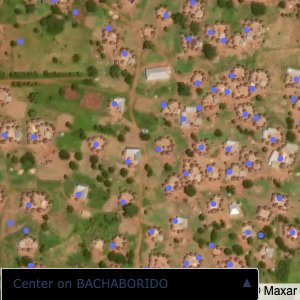
``````{python}
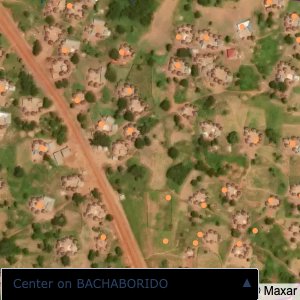
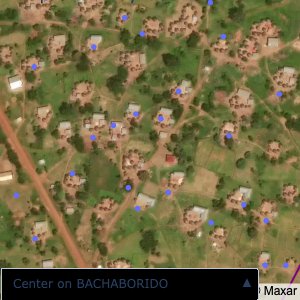
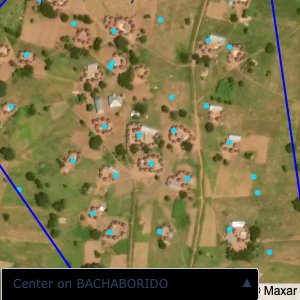
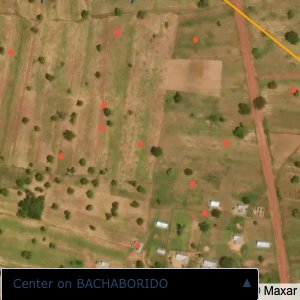
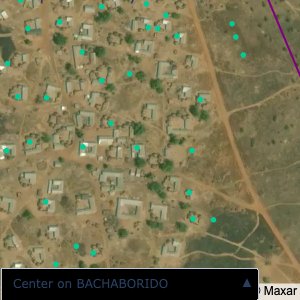
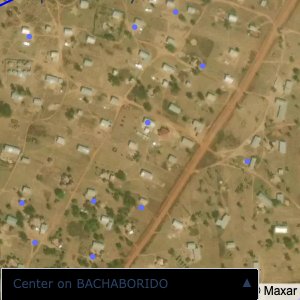
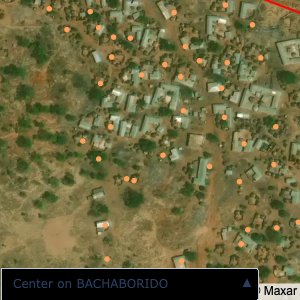
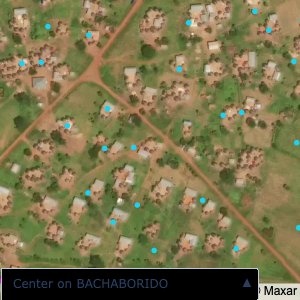
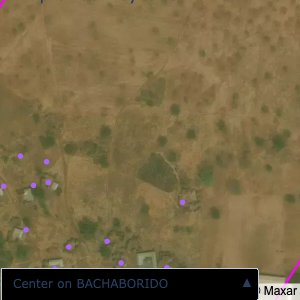
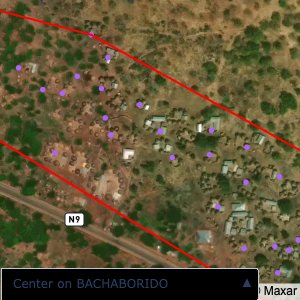
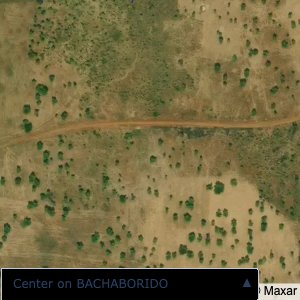
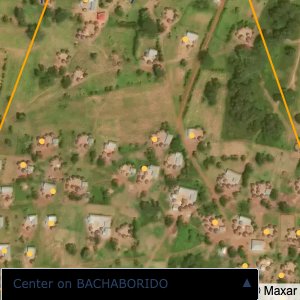
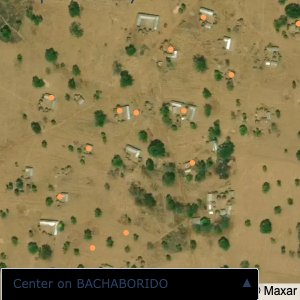
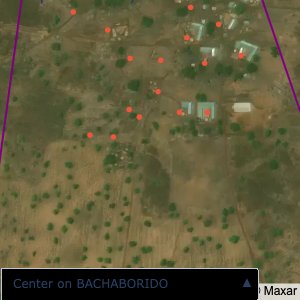
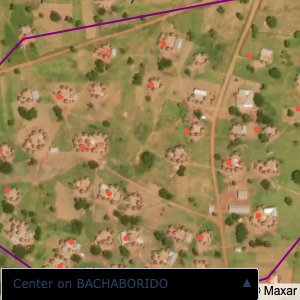
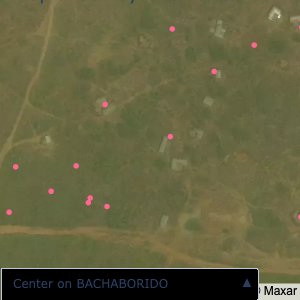
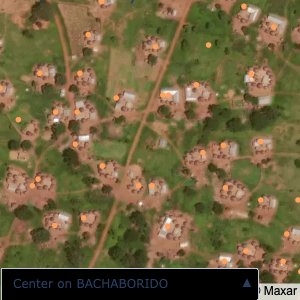
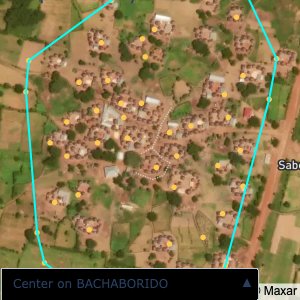
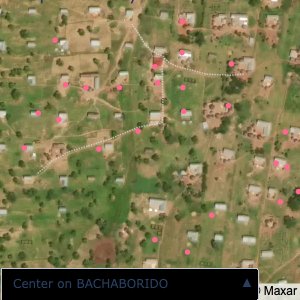
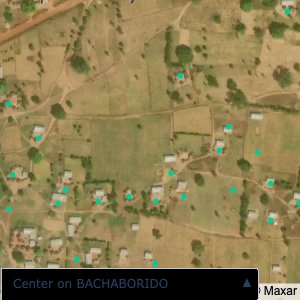
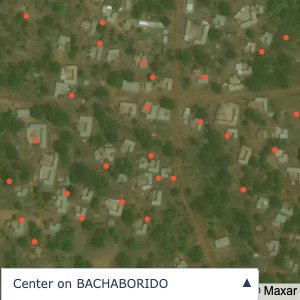
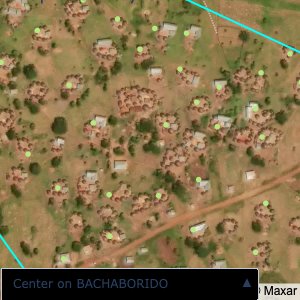
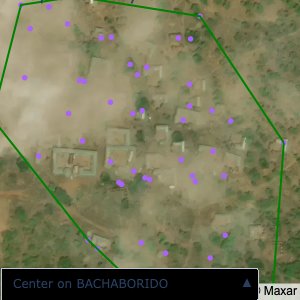
fig = map_areas.plot_community_alpha_shapes(df, gdf, satellite=True)
fig
``````{python}
def gallery(images, row_height="auto"):
"""Shows a set of images in a gallery that flexes with the width of the notebook.
Parameters
----------
images: list of str or bytes
URLs or bytes of images to display
row_height: str
CSS height value to assign to all images. Set to 'auto' by default to show images
with their native dimensions. Set to a value like '250px' to make all rows
in the gallery equal height.
"""
figures = []
for image in images:
src = image
figures.append(
f"""
<figure style="margin: 5px !important;">
<img src="{src}" style="height: {row_height}">
</figure>
"""
)
return HTML(
data=f"""
<div style="display: flex; flex-flow: row wrap; text-align: center;">
{''.join(figures)}
</
"""
)
VILLAGE_DIR = os.path.join(ROOT_DIR, "resources", "images", "villages")
# This takes upto 10 mins
EXPORT_IMAGES = False
# Quarto wants a path relative to working directory
VILLAGE_DIR_RELATIVE = os.path.join("resources", "images", "villages")
# Export images for communties
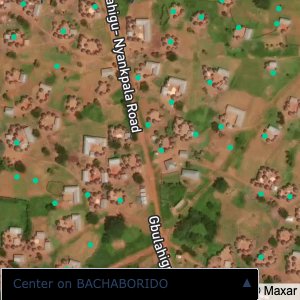
def export_image(fig, row):
fig.update_layout
fig.update_layout(
mapbox=dict(
zoom=16, center=dict(lat=row["centroid_lat"], lon=row["centroid_lon"])
),
)
file_name: str = row["community"].replace("/", " ").replace(".", " ")
fig.write_image(
os.path.join(VILLAGE_DIR, f"{file_name}.png"), width=300, height=300
)
if EXPORT_IMAGES:
for _, row in gdf.iterrows():
export_image(fig, row)
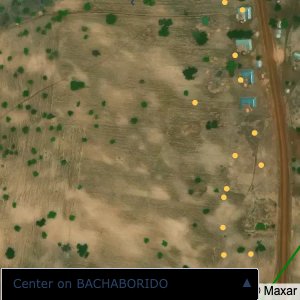
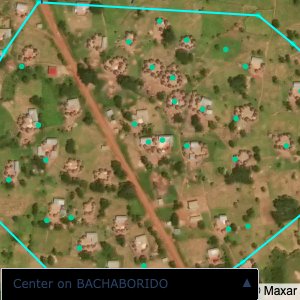
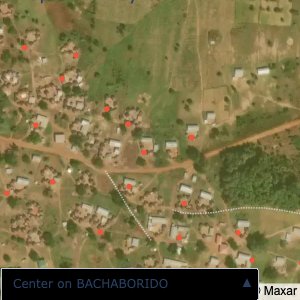
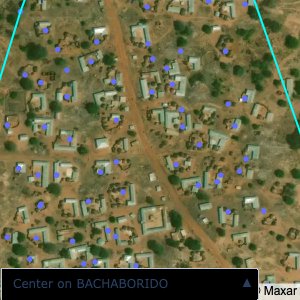
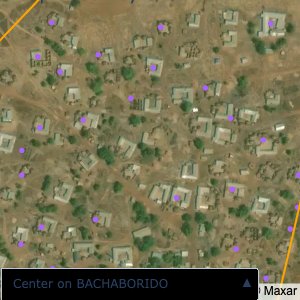
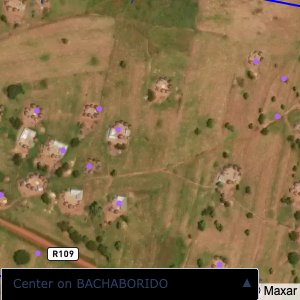
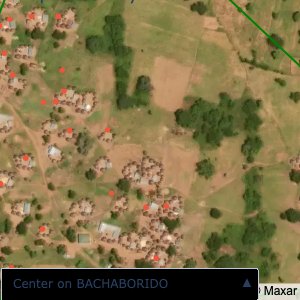
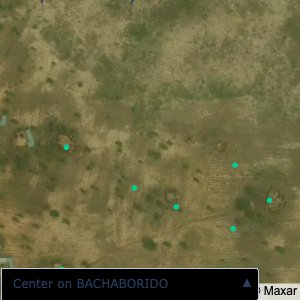
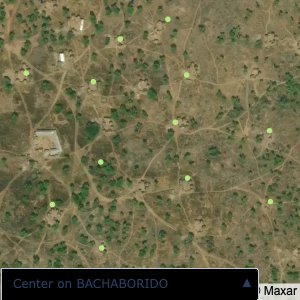
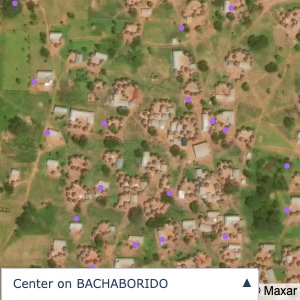
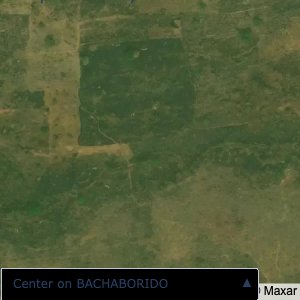
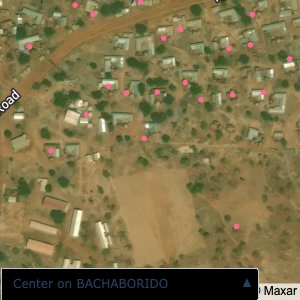
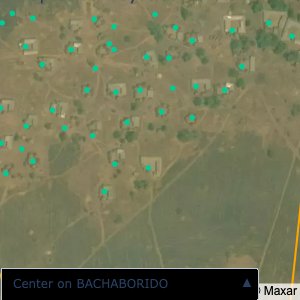
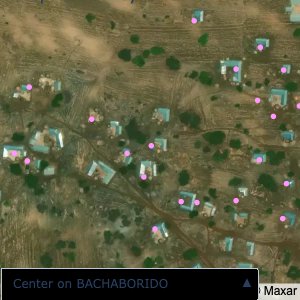
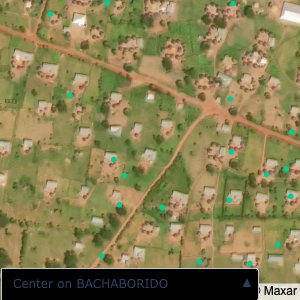
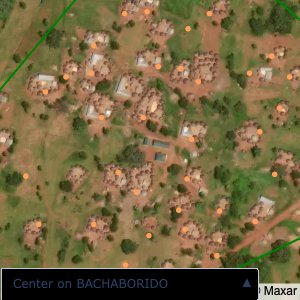
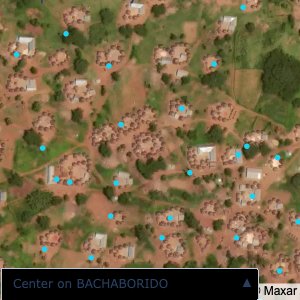
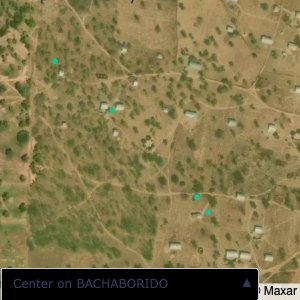
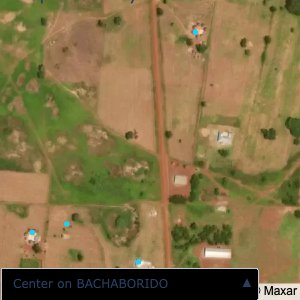
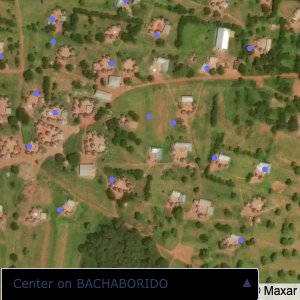
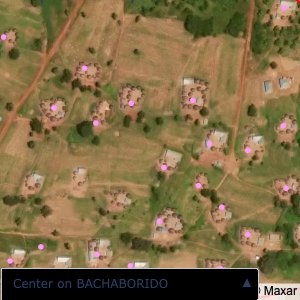
# Read through all the files in VILLAGE_DIR and display using gallery
village_images = [
os.path.join(VILLAGE_DIR_RELATIVE, file) for file in os.listdir(VILLAGE_DIR)
]
gallery(village_images, row_height="300px")
```