Code
```{python}
import pandas as pd
from plotnine import *
from pathlib import Path


PROJ_ROOT = Path("/Users/st2246/Work/Pilot3")
TIDY = PROJ_ROOT / "data/generated/tidy/main"
TRANSFORM = PROJ_ROOT / "data/generated/main/transform"
COMMUNITY_DATA = PROJ_ROOT / "quarto/census_sampling/resources/community_data.dta"

mental_health = pd.read_stata(TIDY / "06_Mental_Health-hh_id-period.dta", convert_categoricals=False)
period_data = pd.read_stata(TIDY / "16_period_hh_level-hh_id-period.dta", convert_categoricals=False)
mental_health = mental_health.merge(period_data[["hh_id", "period", "survey_date"]], on=["hh_id", "period"], how="left")
mental_health["hh_id"] = mental_health["hh_id"].astype(int)
```
Important
We explored this line of work to see if negative mental health (depression, anxiety) is really the opposite of positive mental health. We had noticed that positive / negative mh were positively correlated leading us to this line of work.
However, that result was an error in Simon’s code. I (Simon) had recoded the postive mental health measures (life satisfaction, happiness) such that higher values were worse mental health to make them all point in the same direction (the initial work exploring correlation was to see if we could choose a smaller set of questions for measuring various aspects of mental health; I forgot to note this in the figure thus leading to the confusion).
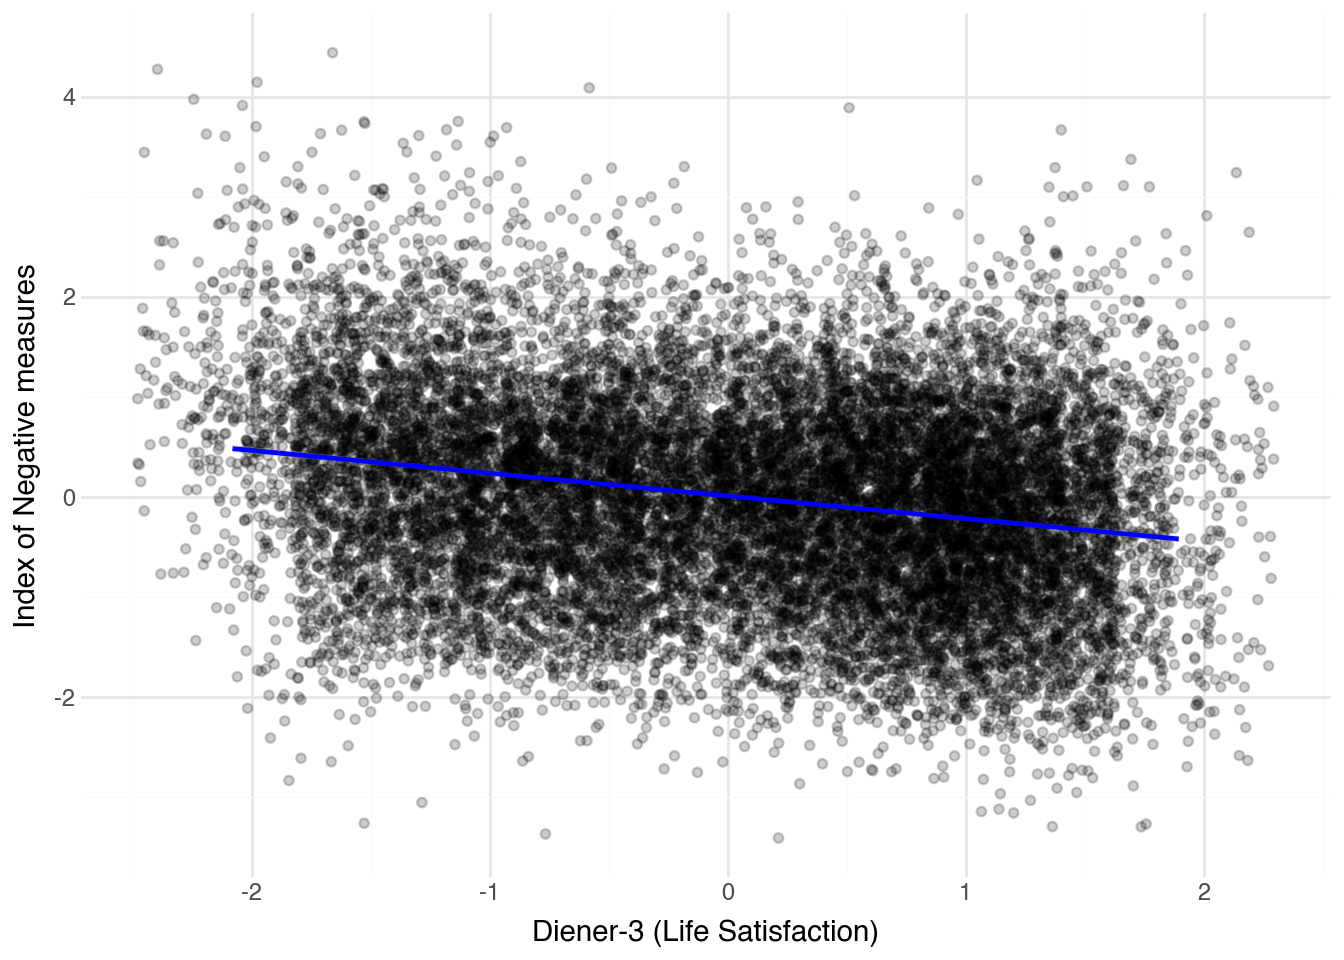
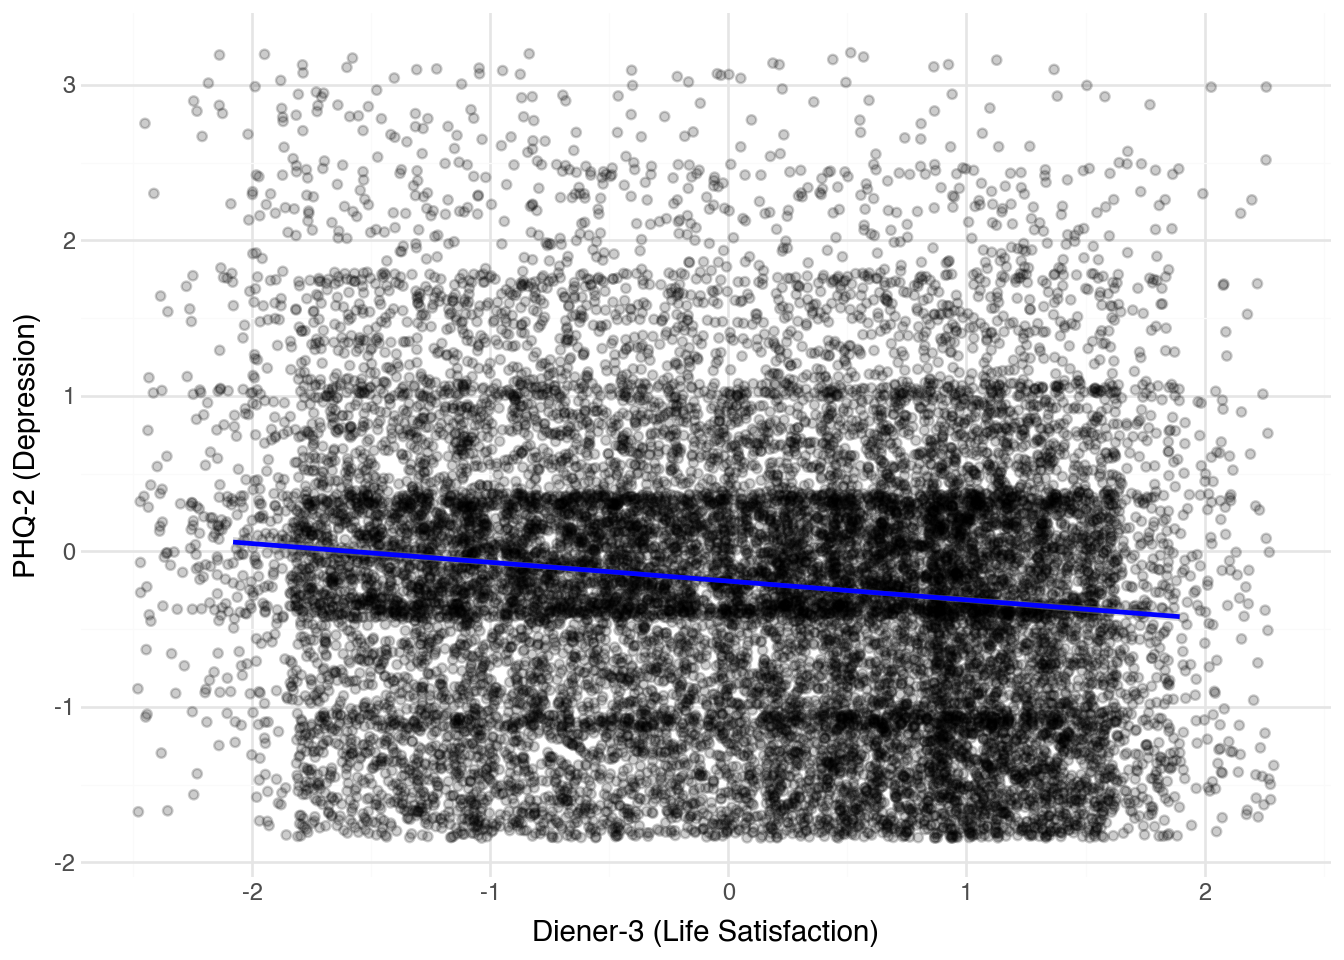
The results below show that positive and negative mental health have the relationship that we would expect.
Positive and Negative MH
Code
```{python}
mental_health_measures = mental_health.copy()

medians = mental_health_measures.groupby("period").agg(
    phq2_z_p50=("phq2_z", lambda x: x.quantile(0.5)),
    gad2_z_p50=("gad2_z", lambda x: x.quantile(0.5)),
    pss4_z_p50=("pss4_z", lambda x: x.quantile(0.5)),
    pswq3_z_p50=("pswq3_z", lambda x: x.quantile(0.5)),
    diener3_p50=("diener3_z", lambda x: x.quantile(0.5)),
)

mental_health_measures = mental_health_measures.merge(medians, on="period", how="left")
# Tag below above medians
mental_health_measures["phq2_above_median"] = (
    mental_health_measures["phq2_z"] > mental_health_measures["phq2_z_p50"]
).astype(int)
mental_health_measures["gad2_above_median"] = (
    mental_health_measures["gad2_z"] > mental_health_measures["gad2_z_p50"]
).astype(int)
mental_health_measures["pss4_above_median"] = (
    mental_health_measures["pss4_z"] > mental_health_measures["pss4_z_p50"]
).astype(int)
mental_health_measures["pswq3_above_median"] = (
    mental_health_measures["pswq3_z"] > mental_health_measures["pswq3_z_p50"]
).astype(int)
mental_health_measures["diener3_above_median"] = (
    mental_health_measures["diener3_z"] > mental_health_measures["diener3_p50"]
).astype(int)

# Great a group variable based on the 4 possible combinatons of phq2_above_median and diener3_above_median (
mental_health_measures["happy_sad_group"] = (
    mental_health_measures["phq2_above_median"].astype(str)
    + "_"
    + mental_health_measures["diener3_above_median"].astype(str)
)

group_map = {
    "0_1": "Happy above p50",
    "1_0": "Sad above p50",
    "0_0": "Both below p50",
    "1_1": "Both above p50",
}
mental_health_measures["happy_sad_group"] = mental_health_measures[
    "happy_sad_group"
].map(group_map)

mental_health_measures["happy_sad_group"] = pd.Categorical(
    mental_health_measures["happy_sad_group"],
    categories=["Happy above p50", "Sad above p50", "Both below p50", "Both above p50"],
    ordered=True,
)

# Print counts of the group
print(mental_health_measures["happy_sad_group"].value_counts())
```
happy_sad_group
Both below p50     6696
Happy above p50    6314
Sad above p50      2395
Both above p50     1595
Name: count, dtype: int64
Code
```{python}
mental_health_measures = mental_health.copy()

medians = mental_health_measures.groupby("period").agg(
    phq2_z_p50=("phq2_z", lambda x: x.quantile(0.75)),
    gad2_z_p50=("gad2_z", lambda x: x.quantile(0.75)),
    pss4_z_p50=("pss4_z", lambda x: x.quantile(0.75)),
    pswq3_z_p50=("pswq3_z", lambda x: x.quantile(0.75)),
    diener3_p50=("diener3_z", lambda x: x.quantile(0.75)),
)

mental_health_measures = mental_health_measures.merge(medians, on="period", how="left")
# Tag below above medians
mental_health_measures["phq2_above_median"] = (
    mental_health_measures["phq2_z"] > mental_health_measures["phq2_z_p50"]
).astype(int)
mental_health_measures["gad2_above_median"] = (
    mental_health_measures["gad2_z"] > mental_health_measures["gad2_z_p50"]
).astype(int)
mental_health_measures["pss4_above_median"] = (
    mental_health_measures["pss4_z"] > mental_health_measures["pss4_z_p50"]
).astype(int)
mental_health_measures["pswq3_above_median"] = (
    mental_health_measures["pswq3_z"] > mental_health_measures["pswq3_z_p50"]
).astype(int)
mental_health_measures["diener3_above_median"] = (
    mental_health_measures["diener3_z"] > mental_health_measures["diener3_p50"]
).astype(int)

# Great a group variable based on the 4 possible combinatons of phq2_above_median and diener3_above_median (
mental_health_measures["happy_sad_group"] = (
    mental_health_measures["phq2_above_median"].astype(str)
    + "_"
    + mental_health_measures["diener3_above_median"].astype(str)
)

group_map = {
    "0_1": "Happy above p75",
    "1_0": "Sad above p75",
    "0_0": "Both below p75",
    "1_1": "Both above p75",
}
mental_health_measures["happy_sad_group"] = mental_health_measures[
    "happy_sad_group"
].map(group_map)

mental_health_measures["happy_sad_group"] = pd.Categorical(
    mental_health_measures["happy_sad_group"],
    categories=["Happy above p75", "Sad above p75", "Both below p75", "Both above p75"],
    ordered=True,
)

# Print counts of the group
print(mental_health_measures["happy_sad_group"].value_counts())
```
happy_sad_group
Both below p75     11219
Happy above p75     2932
Sad above p75       2371
Both above p75       478
Name: count, dtype: int64
Scatterplot
Code
```{python}
import plotly.express as px
from binscatter import binscatter

binscatter(
    mental_health_measures,
    x="diener3_z",
    y="mental_health_index_neg",
    poly_line=1,
)
```
Code
```{python}
(
    ggplot(mental_health_measures, aes(x="diener3_z", y="mental_health_index_neg"))
    + geom_jitter(alpha=0.2)
    + geom_smooth(method="lm", color="blue")
    + labs(x="Diener-3 (Life Satisfaction)", y="Index of Negative measures")
    + theme_minimal()
)
```
/Users/st2246/Work/Pilot3/venv/lib/python3.12/site-packages/plotnine/layer.py:374: PlotnineWarning: geom_jitter : Removed 62 rows containing missing values.
Code
```{python}
(
    ggplot(mental_health_measures, aes(x='diener3_z', y='phq2_z')) +
    geom_jitter(alpha=0.2) +
    geom_smooth(method='lm', color='blue') +
    labs(x='Diener-3 (Life Satisfaction)', y='PHQ-2 (Depression)') +
    theme_minimal()
)
```
/Users/st2246/Work/Pilot3/venv/lib/python3.12/site-packages/plotnine/layer.py:374: PlotnineWarning: geom_jitter : Removed 62 rows containing missing values.
Regressions
Code
```{python}
#| label: neg-mh-on-diener
#| output: asis

import statsmodels.formula.api as smf
from stargazer.stargazer import Stargazer

dep_vars = ["mental_health_index_neg", "phq2_z", "gad2_z", "pswq3_z", "pss4_z"]
models = []
for var in dep_vars:
    df = mental_health.rename(columns={var: "negative_mh"}).copy()
    models.append(smf.ols("diener3_z ~ negative_mh + C(period)", data=df).fit())

sg = Stargazer(models)
sg.title("Negative MH Measures on Life Satisfaction (Diener)")
sg.custom_columns(dep_vars, [1] * len(dep_vars))
sg.show_model_numbers(False)
sg.covariate_order(["Intercept", "negative_mh"])

sg
```
Negative MH Measures on Life Satisfaction (Diener)
Dependent variable: diener3_z mental_health_index_neg phq2_z gad2_z pswq3_z pss4_z Intercept 0.036* -0.000 -0.000 -0.000 -0.000 (0.021) (0.021) (0.021) (0.021) (0.020) negative_mh -0.252*** -0.156*** -0.113*** -0.130*** -0.246*** (0.008) (0.008) (0.008) (0.007) (0.007) Observations 16938 16938 16938 16938 16938 R2 0.068 0.028 0.020 0.027 0.076 Adjusted R2 0.068 0.028 0.020 0.026 0.076 Residual Std. Error 0.980 (df=16929) 1.001 (df=16929) 1.005 (df=16929) 1.002 (df=16929) 0.976 (df=16929) F Statistic 154.539*** (df=8; 16929) 62.012*** (df=8; 16929) 44.286*** (df=8; 16929) 58.163*** (df=8; 16929) 174.618*** (df=8; 16929) Note: * p<0.1; ** p<0.05; *** p<0.01
Code
```{python}
#| label: diener-on-neg-mh
#| output: asis

import statsmodels.formula.api as smf
from stargazer.stargazer import Stargazer

dep_vars = ["mental_health_index_neg", "phq2_z", "gad2_z", "pswq3_z", "pss4_z"]
models = [
    smf.ols(f"{var} ~ diener3_z + C(period)", data=mental_health).fit()
    for var in dep_vars
]

sg = Stargazer(models)
sg.title("Negative MH Measures on Life Satisfaction (Diener)")
sg.custom_columns(dep_vars, [1] * len(dep_vars))
sg.show_model_numbers(False)
sg.covariate_order(["Intercept", "diener3_z"])

sg
```
Negative MH Measures on Life Satisfaction (Diener)
mental_health_index_neg phq2_z gad2_z pswq3_z pss4_z Intercept 0.144*** 0.000 0.000 -0.000 0.000 (0.020) (0.019) (0.021) (0.022) (0.022) diener3_z -0.240*** -0.131*** -0.110*** -0.143*** -0.279*** (0.007) (0.007) (0.008) (0.008) (0.008) Observations 16938 16938 16938 16938 16938 R2 0.085 0.045 0.047 0.040 0.072 Adjusted R2 0.085 0.045 0.046 0.040 0.071 Residual Std. Error 0.957 (df=16929) 0.915 (df=16929) 0.990 (df=16929) 1.051 (df=16929) 1.040 (df=16929) F Statistic 197.727*** (df=8; 16929) 100.531*** (df=8; 16929) 103.913*** (df=8; 16929) 88.070*** (df=8; 16929) 163.446*** (df=8; 16929) Note: * p<0.1; ** p<0.05; *** p<0.01