| Religious Event | Relative Death | Livestock Death | Natural Disaster | Negative shocks | |
| Shock | 0.0940** | -0.1497*** | -0.0922** | -0.1742** | -0.0979** |
| (0.0406) | (0.0385) | (0.0440) | (0.0868) | (0.0408) | |
| Household FE | Yes | Yes | Yes | Yes | Yes |
| Period FE | Yes | Yes | Yes | Yes | Yes |
| N | 14,666 | 14,666 | 14,666 | 14,666 | 14,666 |
| R² (within) | 0.0018 | 0.0005 | 0.0002 | 0.0003 | 0.0003 |
| N (positive) | 773 | 667 | 440 | 81 | 513 |
| *p<0.1; **p<0.05; ***p<0.01 | |||||
More detailed breakdown on impacts of shocks and efficient measuring of mental health
Abstract
Descriptives on shocks, mental health dynamics and correlation between measures
Shocks
Impact of Shocks on Mental Health
Note
A negative shock is either a natural disaster or a livestock death. The N (positive) row in the table below indicate how many of each shock kind we’ve had in the study. Additionally, more descriptives are available below
The regressions below show the impact of having a shock within a study period on participants’ mental health. Overall, funerals improve mental health, which is not unexpected since they are a large ceremony in rural Ghana according to Damien. Additionally, the questionnaires don’t necessarily specify who’s funeral it is and so the most salient part of the funeral might be the ceremony. However, death of livestock and natural disasters also improve mental health. And, religious events seem to decrease it.
All the regressions included household and period fixed effects. The results are robust to survey month FEs, as well as no time FEs at all. They are also directionally consistent when using different measures of mental health or when only considering the control group, though magnitudes and significance vary (see appendix for more results)
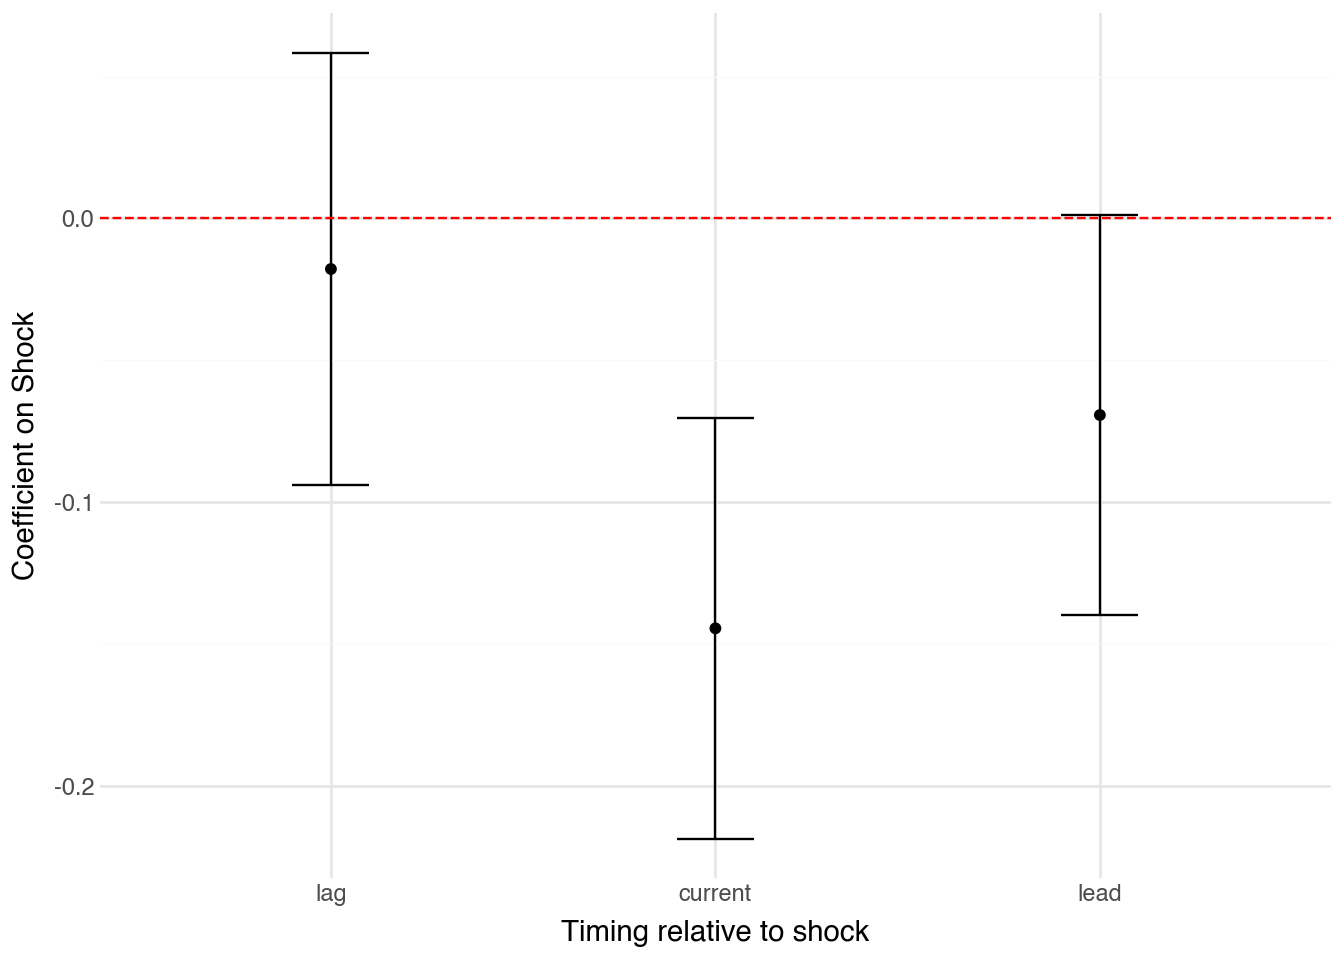
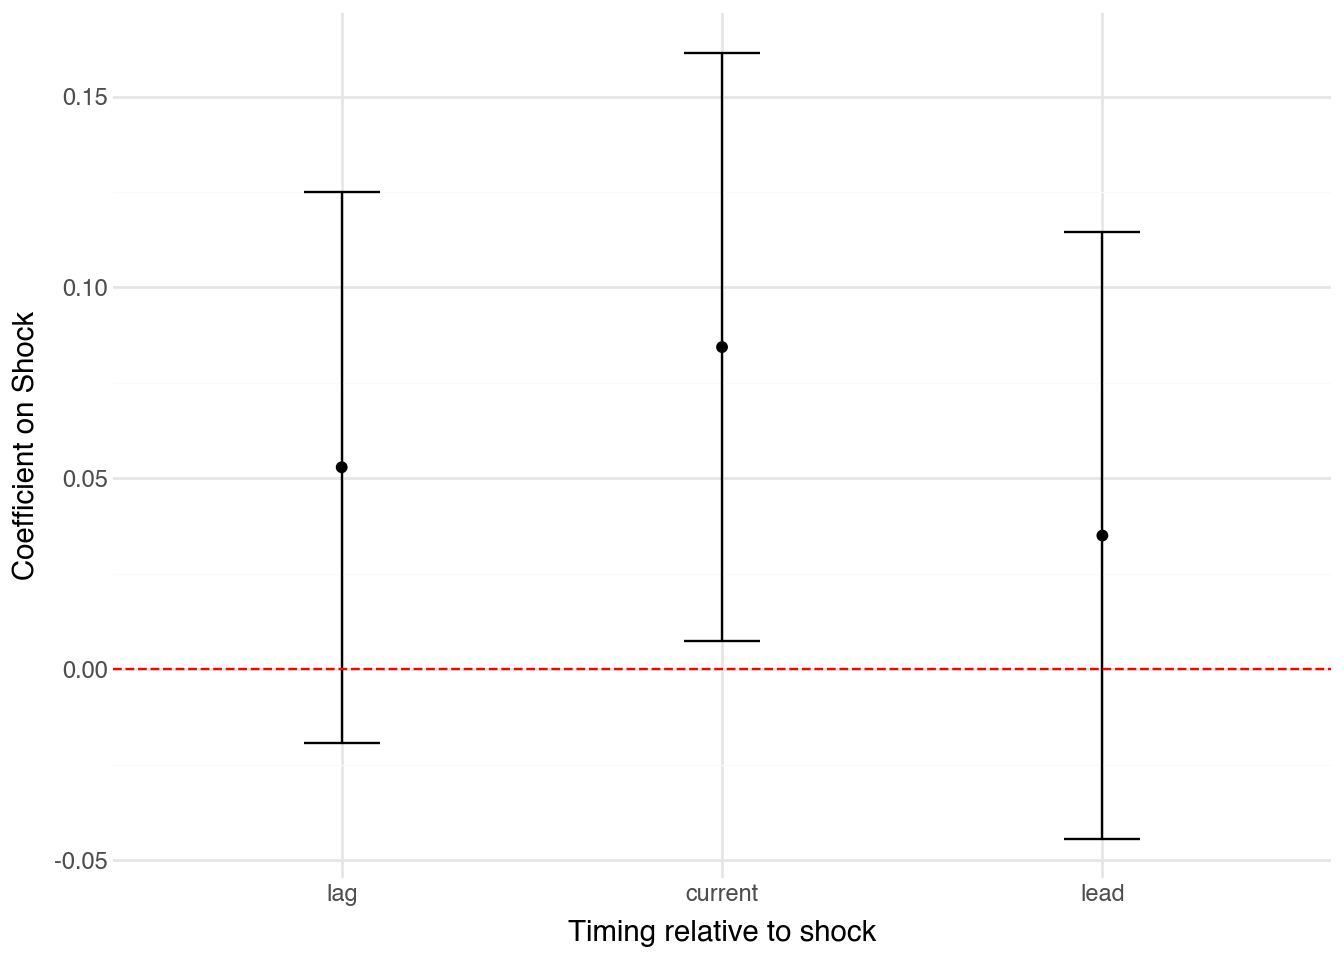
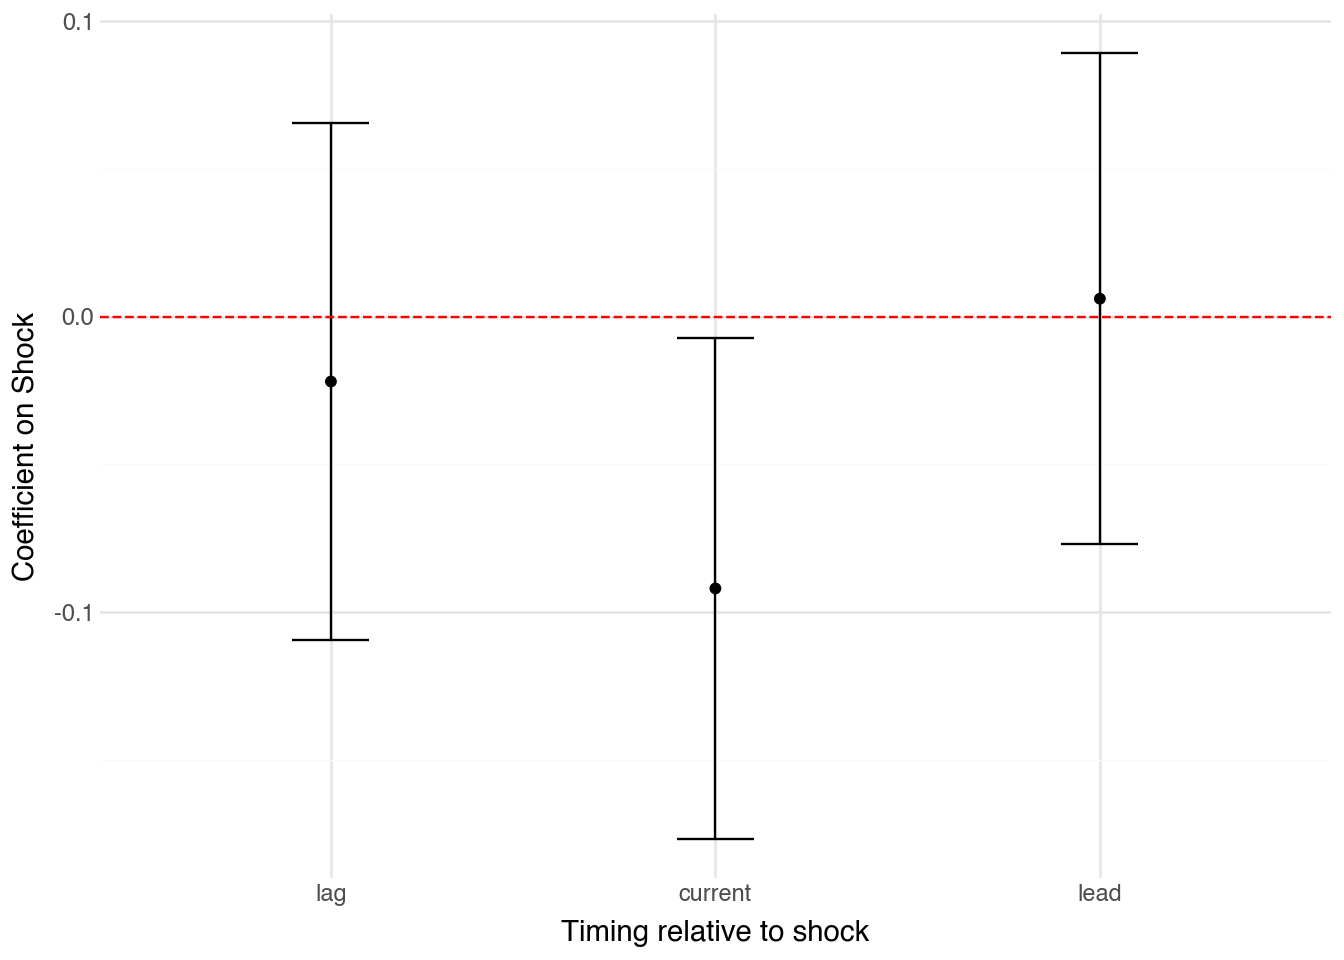
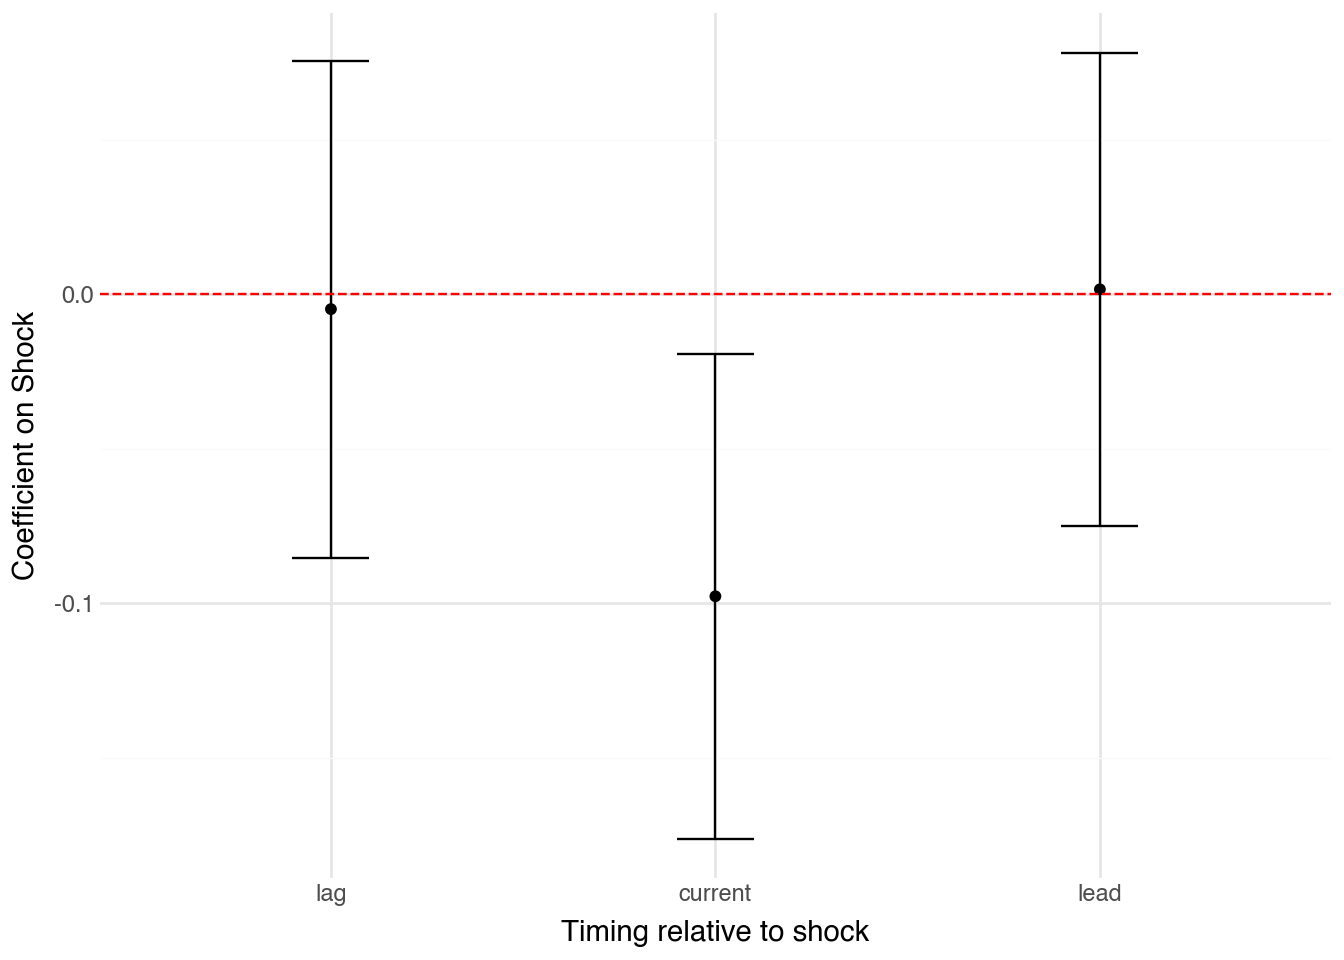
Impacts of Shocks - Dynamics
One potential story is the shocks aren’t instant but continuous stressors. For example, the death of a relative could be preceeded by periods of illness, large health care costs and so on. Thus, the actual shock itself might not make things worse.
In such a scenario, shocks would have impact mental health in the period before the actual shock itself. However, regression results don’t support this idea.
Cost of shocks
The impact of a shock does not seem to be affected by the costs associated with it. Below, the coefficients associated with the shock costs are per 100 cedis
| Religious Event | Relative Death | Livestock Death | Natural Disaster | Negative shocks | |
| Shock | 0.1116** | -0.1333*** | -0.0801 | -0.1140 | -0.0878* |
| (0.0492) | (0.0417) | (0.0501) | (0.1102) | (0.0462) | |
| Shock Cost | -0.00487060 | -0.00341268 | -0.00135938 | -0.01536153 | -0.00120463 |
| (0.00846744) | (0.00346892) | (0.00179716) | (0.01557997) | (0.00181409) | |
| Household FE | Yes | Yes | Yes | Yes | Yes |
| Period FE | Yes | Yes | Yes | Yes | Yes |
| N | 14,666 | 14,666 | 14,666 | 14,666 | 14,666 |
| R² (within) | 0.0018 | 0.0006 | 0.0003 | 0.0003 | 0.0004 |
| N (positive) | 773 | 667 | 440 | 81 | 513 |
| *p<0.1; **p<0.05; ***p<0.01 | |||||
Hetereogeneity by household characteristics
There seems to be some heterogeneity in the shock impacts. Notably, funerals improve MH for HHs with good mental health at baseline. And, religious events have negative impacts on those who are below median on the census wealth index (could be because associated costs are more burdensome for poorer households).
| Religious Event | Relative Death | Livestock Death | Natural Disaster | Negative shocks | |
| Shock | 0.1108* | -0.2275*** | -0.0748 | -0.1597 | -0.0855 |
| (0.0578) | (0.0526) | (0.0645) | (0.1178) | (0.0595) | |
| Household FE | Yes | Yes | Yes | Yes | Yes |
| Period FE | Yes | Yes | Yes | Yes | Yes |
| N | 7,402 | 7,402 | 7,402 | 7,402 | 7,402 |
| R² (within) | 0.0020 | 0.0013 | -0.0000 | 0.0002 | 0.0001 |
| N (positive) | 383 | 347 | 224 | 42 | 260 |
| *p<0.1; **p<0.05; ***p<0.01 | |||||
| Religious Event | Relative Death | Livestock Death | Natural Disaster | Negative shocks | |
| Shock | 0.0767 | -0.0646 | -0.1107* | -0.1863 | -0.1111** |
| (0.0570) | (0.0564) | (0.0597) | (0.1272) | (0.0558) | |
| Household FE | Yes | Yes | Yes | Yes | Yes |
| Period FE | Yes | Yes | Yes | Yes | Yes |
| N | 7,264 | 7,264 | 7,264 | 7,264 | 7,264 |
| R² (within) | 0.0015 | 0.0000 | 0.0006 | 0.0003 | 0.0007 |
| N (positive) | 390 | 320 | 216 | 39 | 253 |
| *p<0.1; **p<0.05; ***p<0.01 | |||||
| Religious Event | Relative Death | Livestock Death | Natural Disaster | Negative shocks | |
| Shock | 0.0218 | -0.1663*** | -0.0557 | -0.1253 | -0.0501 |
| (0.0529) | (0.0538) | (0.0596) | (0.1184) | (0.0558) | |
| Household FE | Yes | Yes | Yes | Yes | Yes |
| Period FE | Yes | Yes | Yes | Yes | Yes |
| N | 7,425 | 7,425 | 7,425 | 7,425 | 7,425 |
| R² (within) | 0.0004 | 0.0007 | 0.0001 | 0.0001 | 0.0001 |
| N (positive) | 430 | 321 | 246 | 40 | 280 |
| *p<0.1; **p<0.05; ***p<0.01 | |||||
| Religious Event | Relative Death | Livestock Death | Natural Disaster | Negative shocks | |
| Shock | 0.1805*** | -0.1337** | -0.1417** | -0.2271* | -0.1597*** |
| (0.0627) | (0.0549) | (0.0653) | (0.1274) | (0.0598) | |
| Household FE | Yes | Yes | Yes | Yes | Yes |
| Period FE | Yes | Yes | Yes | Yes | Yes |
| N | 7,241 | 7,241 | 7,241 | 7,241 | 7,241 |
| R² (within) | 0.0036 | 0.0003 | 0.0005 | 0.0004 | 0.0008 |
| N (positive) | 343 | 346 | 194 | 41 | 233 |
| *p<0.1; **p<0.05; ***p<0.01 | |||||
Selection Effects
Shocked households seem to be somewhat richer and larger. However, these should not bias the regression results since we are controlling for household fixed effects.
Baseline Balance of shocked and unshocked households
| Variable | Shocked (mean) | Not shocked (mean) | Diff | Norm. diff | p-value |
|---|---|---|---|---|---|
| PHQ-8 (depression, z) | 0.058 | -0.010 | 0.068 | 0.069 | 0.236 |
| GAD-7 (anxiety, z) | 0.043 | -0.008 | 0.051 | 0.051 | 0.382 |
| PSS-10 (stress, z) | 0.046 | -0.008 | 0.055 | 0.055 | 0.336 |
| PSWQ-16 (worry, z) | -0.033 | 0.006 | -0.040 | -0.040 | 0.479 |
| Diener-5 (wellbeing, z) | 0.085 | -0.015 | 0.100 | 0.101 | 0.078 |
| MH index (average) | 0.038 | -0.007 | 0.044 | 0.066 | 0.251 |
| Cantril (total) | 10.948 | 11.222 | -0.274 | -0.072 | 0.217 |
| Wealth index (census) | -0.179 | -0.268 | 0.089 | 0.139 | 0.019 |
| Total consumption (AE, win.) | 345.771 | 344.722 | 1.049 | 0.005 | 0.935 |
| Food consumption (AE, win.) | 264.772 | 253.476 | 11.296 | 0.061 | 0.309 |
| Total income (AE, win.) | 91.269 | 83.142 | 8.127 | 0.046 | 0.420 |
| Current savings (win.) | 307.045 | 264.818 | 42.227 | 0.090 | 0.132 |
| Livestock owned (win.) | 4000.285 | 2708.229 | 1292.056 | 0.164 | 0.011 |
| Durable goods value (win.) | 9543.798 | 8335.584 | 1208.214 | 0.134 | 0.030 |
| Loans taken | 0.608 | 0.549 | 0.059 | 0.059 | 0.309 |
| Household size | 8.043 | 7.655 | 0.389 | 0.146 | 0.012 |
| Participant age | 32.931 | 32.671 | 0.260 | 0.029 | 0.612 |
| Education (years) | 1.366 | 1.498 | -0.133 | -0.039 | 0.497 |
| Number of children | 4.542 | 4.299 | 0.243 | 0.109 | 0.067 |
| Number of adults | 3.527 | 3.367 | 0.161 | 0.154 | 0.007 |
| Dependency ratio | 1.415 | 1.393 | 0.021 | 0.028 | 0.641 |
| Body weight (kg) | 57.001 | 58.103 | -1.102 | -0.076 | 0.124 |
| Dietary diversity (HDDS) | 5.144 | 5.045 | 0.099 | 0.052 | 0.367 |
| Food insecurity index | 0.001 | -0.003 | 0.004 | 0.006 | 0.919 |
| Medical expenses | 84.324 | 69.527 | 14.797 | 0.040 | 0.559 |
| Welch's t-test (unequal variance). Norm. diff = difference / sqrt((s²_shocked + s²_not) / 2). | |||||
Selection into who reports a shock
It seems that people with worse mental health at time of survey are more likely to report a shock. However, this isn’t perfectly consistent across measures.
| Relative Death | Religious Event | Negative Shock | Livestock Death | Natural Disaster | |
| Shock | 0.0918* | 0.0142 | 0.0093 | -0.0071 | 0.0721 |
| (0.0476) | (0.0900) | (0.0463) | (0.0457) | (0.0725) | |
| Community FE | Yes | Yes | Yes | Yes | Yes |
| N | 2,186 | 2,186 | 2,186 | 2,186 | 2,186 |
| R² | 0.1777 | 0.1763 | 0.1763 | 0.1763 | 0.1767 |
| N Reported Shocks | 1,228 | 1,723 | 1,198 | 1,059 | 290 |
| *p<0.1; **p<0.05; ***p<0.01 | |||||
| Relative Death | Religious Event | Negative Shock | Livestock Death | Natural Disaster | |
| Shock | 0.1506*** | 0.0507 | 0.0901* | 0.0590 | 0.1081 |
| (0.0486) | (0.0923) | (0.0464) | (0.0459) | (0.0725) | |
| Community FE | Yes | Yes | Yes | Yes | Yes |
| N | 2,186 | 2,186 | 2,186 | 2,186 | 2,186 |
| R² | 0.0886 | 0.0845 | 0.0860 | 0.0850 | 0.0853 |
| N Reported Shocks | 1,228 | 1,723 | 1,198 | 1,059 | 290 |
| *p<0.1; **p<0.05; ***p<0.01 | |||||
| Relative Death | Religious Event | Negative Shock | Livestock Death | Natural Disaster | |
| Shock | 0.0994* | -0.0330 | 0.0528 | 0.0190 | 0.1742** |
| (0.0522) | (0.0979) | (0.0492) | (0.0492) | (0.0788) | |
| Community FE | Yes | Yes | Yes | Yes | Yes |
| N | 2,186 | 2,186 | 2,186 | 2,186 | 2,186 |
| R² | 0.1021 | 0.1006 | 0.1010 | 0.1006 | 0.1028 |
| N Reported Shocks | 1,228 | 1,723 | 1,198 | 1,059 | 290 |
| *p<0.1; **p<0.05; ***p<0.01 | |||||
| Relative Death | Religious Event | Negative Shock | Livestock Death | Natural Disaster | |
| Shock | 0.1413** | -0.1806* | -0.0074 | -0.0070 | 0.0307 |
| (0.0556) | (0.0991) | (0.0544) | (0.0532) | (0.0826) | |
| Community FE | Yes | Yes | Yes | Yes | Yes |
| N | 2,186 | 2,186 | 2,186 | 2,186 | 2,186 |
| R² | 0.1156 | 0.1143 | 0.1128 | 0.1128 | 0.1129 |
| N Reported Shocks | 1,228 | 1,723 | 1,198 | 1,059 | 290 |
| *p<0.1; **p<0.05; ***p<0.01 | |||||
| Relative Death | Religious Event | Negative Shock | Livestock Death | Natural Disaster | |
| Shock | 0.1070** | 0.1253 | 0.0206 | 0.0050 | 0.0697 |
| (0.0452) | (0.0831) | (0.0439) | (0.0431) | (0.0668) | |
| Community FE | Yes | Yes | Yes | Yes | Yes |
| N | 2,186 | 2,186 | 2,186 | 2,186 | 2,186 |
| R² | 0.1728 | 0.1715 | 0.1706 | 0.1705 | 0.1710 |
| N Reported Shocks | 1,228 | 1,723 | 1,198 | 1,059 | 290 |
| *p<0.1; **p<0.05; ***p<0.01 | |||||
| Relative Death | Religious Event | Negative Shock | Livestock Death | Natural Disaster | |
| Shock | 0.0998** | -0.0412 | 0.0735* | 0.0617 | 0.0684 |
| (0.0439) | (0.0865) | (0.0436) | (0.0432) | (0.0681) | |
| Community FE | Yes | Yes | Yes | Yes | Yes |
| N | 2,186 | 2,186 | 2,186 | 2,186 | 2,186 |
| R² | 0.1539 | 0.1520 | 0.1530 | 0.1527 | 0.1523 |
| N Reported Shocks | 1,228 | 1,723 | 1,198 | 1,059 | 290 |
| *p<0.1; **p<0.05; ***p<0.01 | |||||
Community Effects
Below, we take a look at how being a in community that is shocked affects a household. Note that being in a shocked is a reasonably good predictor of experiencing a shock (see table in appendix)
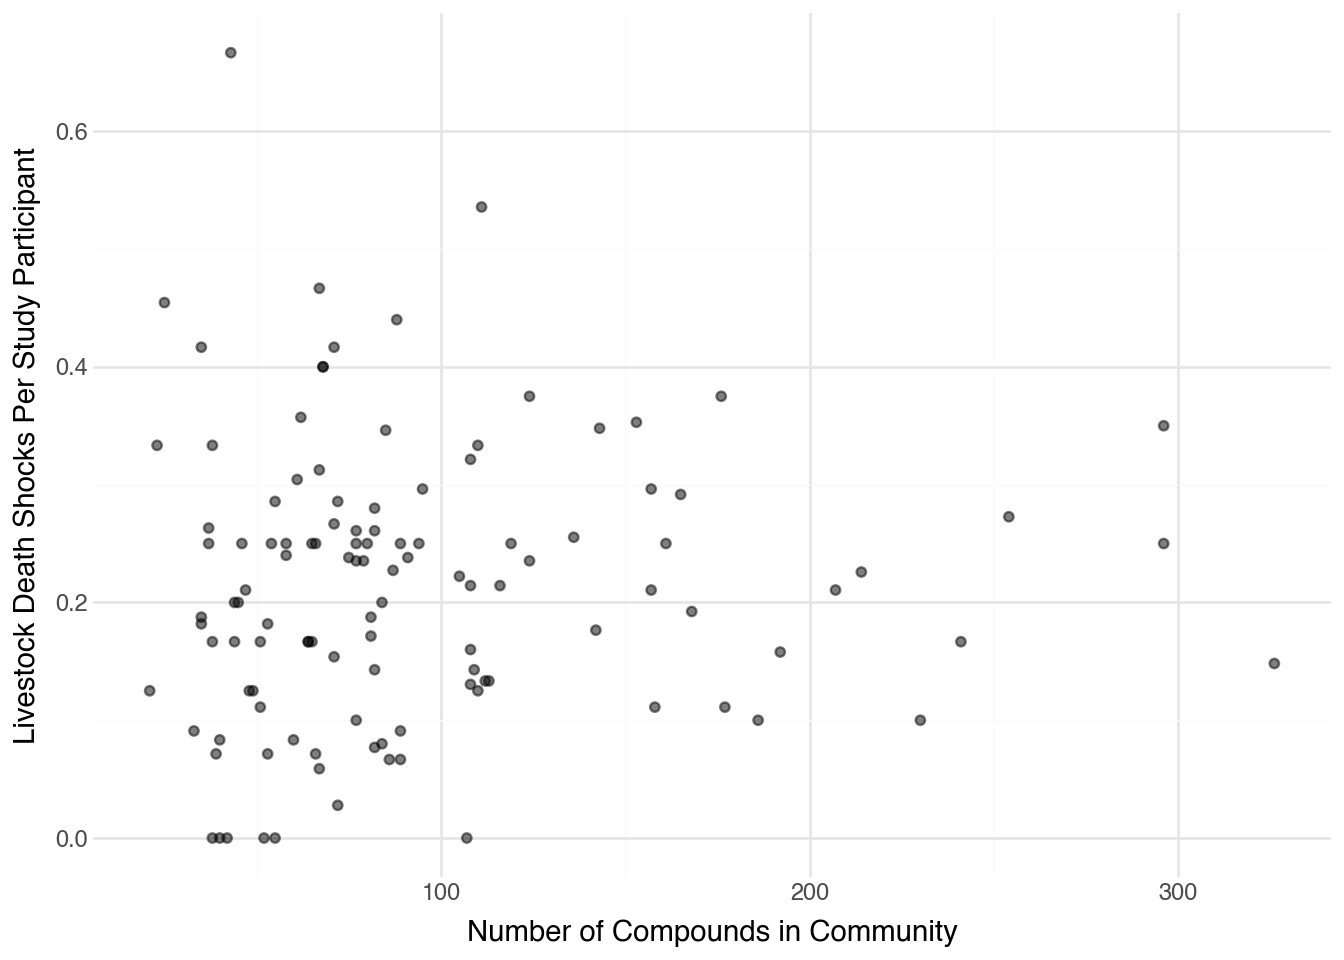
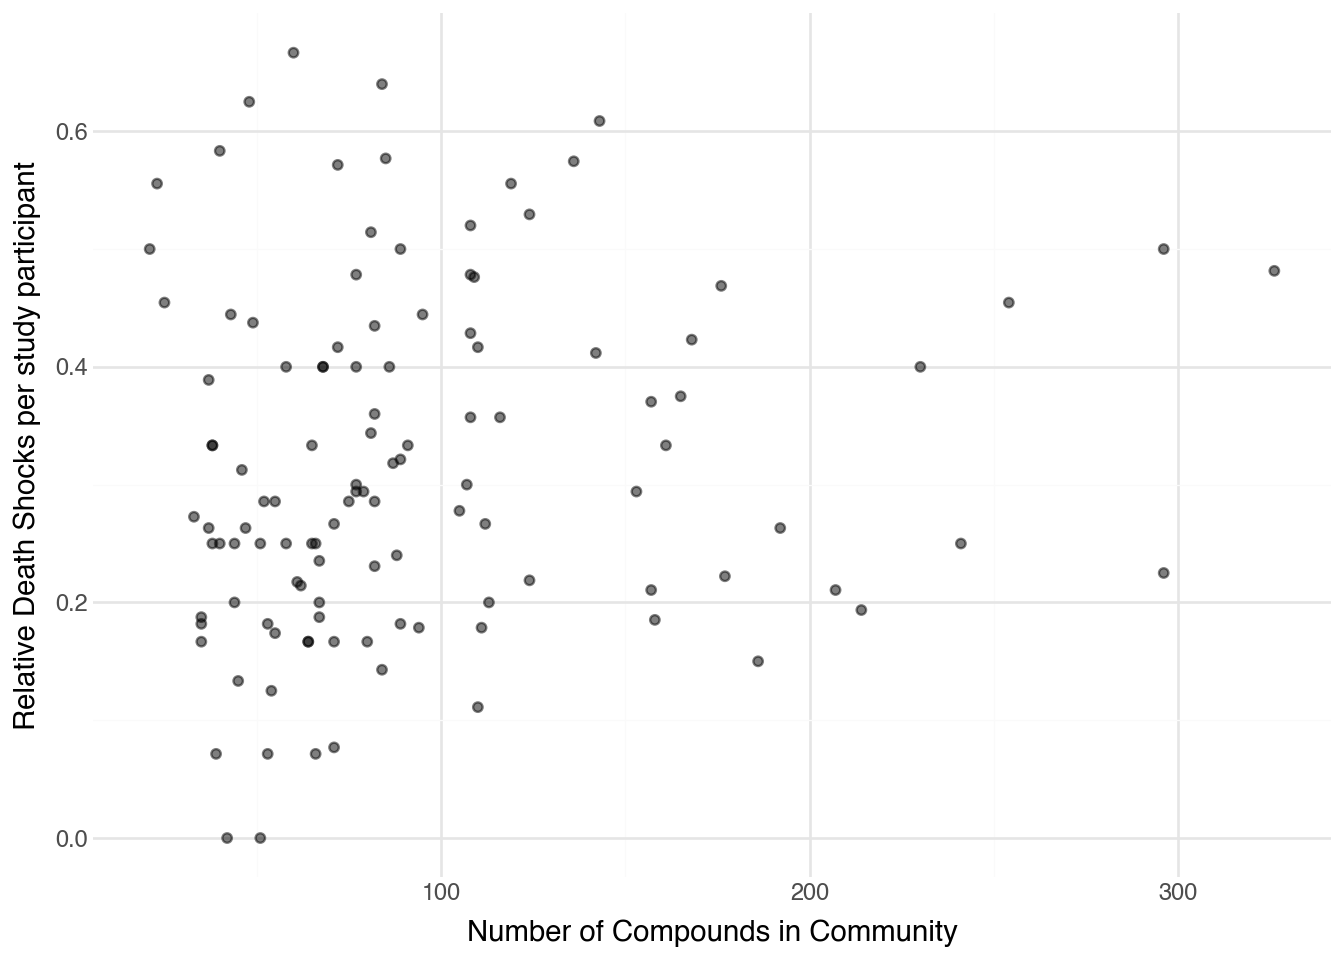
Being in a community with more shocks
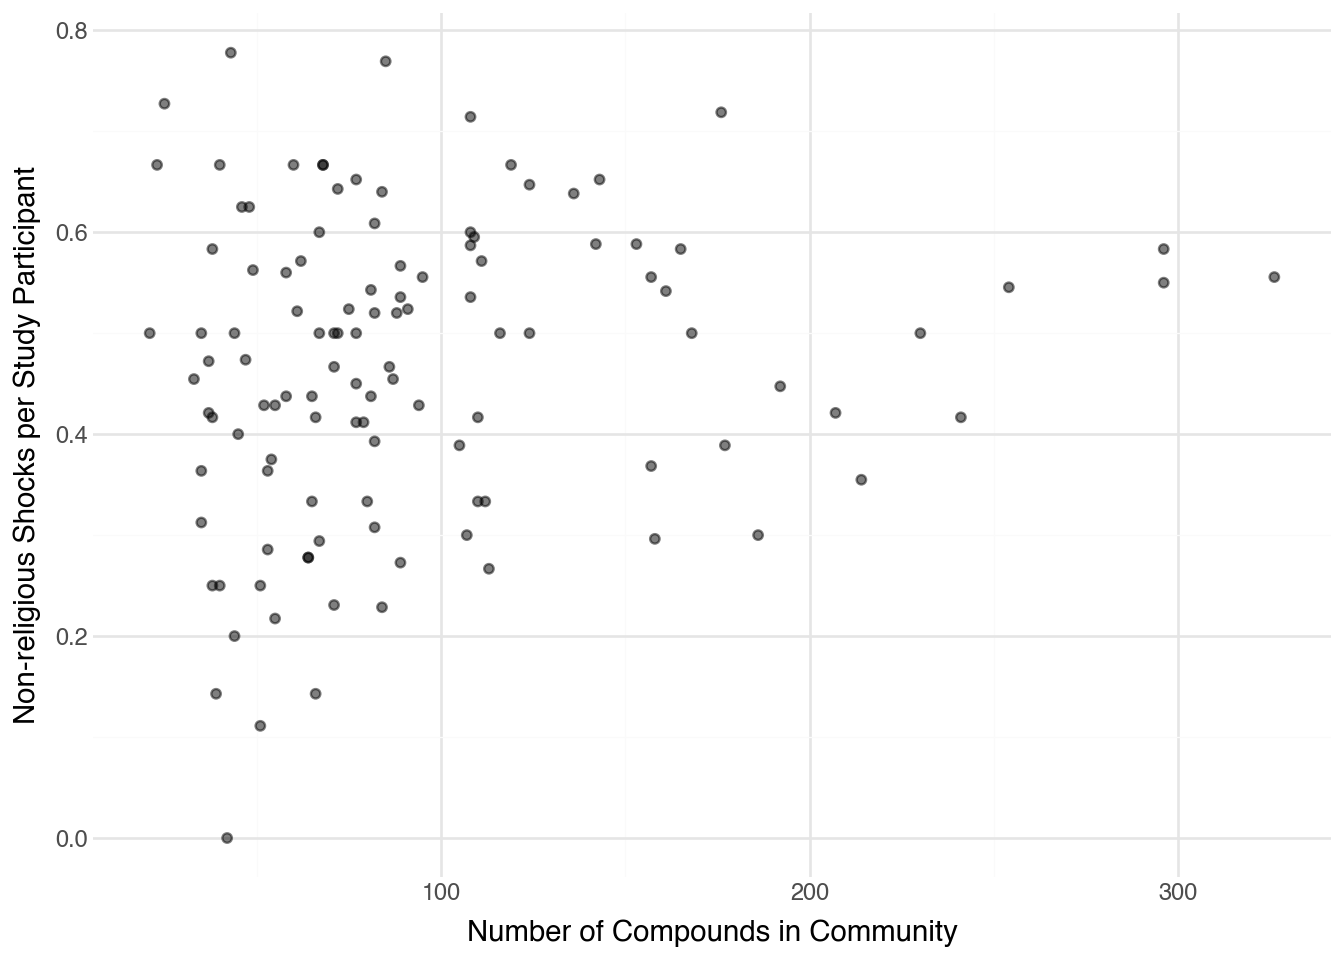
Below, we define number of shocks per community member in each period as a measure of shock density. Community size is defined as both the number of participants in a community. Shocks per participant calculation excludes the household’s own shock, so a household isn’t “predicting itself” by reporting a shock. We find that being in a community with more shocks is associated with better mental health.
| Non-religious shocks | Negative shocks | Funeral / Death of relative | |
| Community shocks / participant | -0.3032*** | -0.3492** | -0.2831* |
| (0.1070) | (0.1540) | (0.1557) | |
| Household FE | Yes | Yes | Yes |
| Period FE | Yes | Yes | Yes |
| N | 14,666 | 14,666 | 14,666 |
| R² (within) | -0.0019 | -0.0002 | -0.0014 |
| *p<0.1; **p<0.05; ***p<0.01 | |||
Interaction with Community Effects
It doesn’t seem that there is much interaction between experiencing a shock and being a community that is shocked a lot. As seen in previous regressions, shocks and being a in a shocked community seemingly improves mental health, but the interaction between the two is generally insignificant, though notable in magnitude.
| Non-religious shocks | Non-religious shocks w/ int. | Negative Shocks | Negative shocks w/ int | Funeral / Death of relative | Funeral / Death of relative w/ int | |
| Shocked (individual) | -0.1208*** | -0.0688 | -0.0921** | -0.0832 | -0.1454*** | -0.1447*** |
| (0.0304) | (0.0473) | (0.0409) | (0.0579) | (0.0385) | (0.0539) | |
| Community shocks / participant | -0.2696** | -0.2161* | -0.3280** | -0.3194** | -0.2470 | -0.2463 |
| (0.1067) | (0.1146) | (0.1542) | (0.1604) | (0.1555) | (0.1619) | |
| Shocked × community shocks / participant | -0.3507 | -0.1256 | -0.0074 | |||
| (0.2487) | (0.5082) | (0.4307) | ||||
| Household FE | Yes | Yes | Yes | Yes | Yes | Yes |
| Period FE | Yes | Yes | Yes | Yes | Yes | Yes |
| N | 14,666 | 14,666 | 14,666 | 14,666 | 14,666 | 14,666 |
| R² (within) | -0.0013 | -0.0012 | 0.0001 | 0.0001 | -0.0009 | -0.0009 |
| *p<0.1; **p<0.05; ***p<0.01 | ||||||
| Non-religious shocks | Non-religious shocks w/ int. | Negative Shocks | Negative shocks w/ int | Funeral / Death of relative | Funeral / Death of relative w/ int | |
| Shocked (individual) | -0.0943*** | -0.0783 | -0.0581 | -0.0282 | -0.1300*** | -0.1380** |
| (0.0315) | (0.0483) | (0.0432) | (0.0608) | (0.0394) | (0.0569) | |
| Community shocks / participant | -0.2731** | -0.2566** | -0.4107*** | -0.3816** | -0.1817 | -0.1902 |
| (0.1112) | (0.1174) | (0.1556) | (0.1614) | (0.1588) | (0.1656) | |
| Shocked × community shocks / participant | -0.1082 | -0.4211 | 0.0847 | |||
| (0.2713) | (0.5853) | (0.4664) | ||||
| Household FE | Yes | Yes | Yes | Yes | Yes | Yes |
| Period FE | Yes | Yes | Yes | Yes | Yes | Yes |
| N | 14,666 | 14,666 | 14,666 | 14,666 | 14,666 | 14,666 |
| R² (within) | -0.0051 | -0.0051 | -0.0016 | -0.0014 | -0.0027 | -0.0027 |
| *p<0.1; **p<0.05; ***p<0.01 | ||||||
| Non-religious shocks | Non-religious shocks w/ int. | Negative Shocks | Negative shocks w/ int | Funeral / Death of relative | Funeral / Death of relative w/ int | |
| Shocked (individual) | -0.0930*** | -0.0341 | -0.0342 | -0.0254 | -0.1438*** | -0.1343** |
| (0.0348) | (0.0538) | (0.0498) | (0.0664) | (0.0434) | (0.0630) | |
| Community shocks / participant | -0.1861 | -0.1256 | -0.2757 | -0.2672 | -0.1241 | -0.1140 |
| (0.1204) | (0.1288) | (0.1695) | (0.1766) | (0.1773) | (0.1836) | |
| Shocked × community shocks / participant | -0.3969 | -0.1240 | -0.1009 | |||
| (0.3040) | (0.6272) | (0.5168) | ||||
| Household FE | Yes | Yes | Yes | Yes | Yes | Yes |
| Period FE | Yes | Yes | Yes | Yes | Yes | Yes |
| N | 14,666 | 14,666 | 14,666 | 14,666 | 14,666 | 14,666 |
| R² (within) | -0.0043 | -0.0039 | -0.0015 | -0.0014 | -0.0024 | -0.0024 |
| *p<0.1; **p<0.05; ***p<0.01 | ||||||
| Non-religious shocks | Non-religious shocks w/ int. | Negative Shocks | Negative shocks w/ int | Funeral / Death of relative | Funeral / Death of relative w/ int | |
| Shocked (individual) | -0.0611 | -0.0515 | -0.0776 | -0.1320* | -0.0598 | -0.0580 |
| (0.0391) | (0.0607) | (0.0532) | (0.0733) | (0.0503) | (0.0725) | |
| Community shocks / participant | -0.1195 | -0.1096 | 0.0382 | -0.0145 | -0.2492 | -0.2473 |
| (0.1302) | (0.1394) | (0.1891) | (0.1973) | (0.1844) | (0.1908) | |
| Shocked × community shocks / participant | -0.0652 | 0.7644 | -0.0190 | |||
| (0.3082) | (0.6542) | (0.5277) | ||||
| Household FE | Yes | Yes | Yes | Yes | Yes | Yes |
| Period FE | Yes | Yes | Yes | Yes | Yes | Yes |
| N | 14,666 | 14,666 | 14,666 | 14,666 | 14,666 | 14,666 |
| R² (within) | 0.0005 | 0.0004 | 0.0002 | 0.0004 | 0.0003 | 0.0003 |
| *p<0.1; **p<0.05; ***p<0.01 | ||||||
| Non-religious shocks | Non-religious shocks w/ int. | Negative Shocks | Negative shocks w/ int | Funeral / Death of relative | Funeral / Death of relative w/ int | |
| Shocked (individual) | -0.0840** | -0.0389 | -0.0646 | -0.0643 | -0.0989** | -0.1302** |
| (0.0359) | (0.0568) | (0.0504) | (0.0721) | (0.0448) | (0.0629) | |
| Community shocks / participant | -0.2975** | -0.2511** | -0.1881 | -0.1877 | -0.4252** | -0.4584** |
| (0.1172) | (0.1262) | (0.1882) | (0.1935) | (0.1709) | (0.1803) | |
| Shocked × community shocks / participant | -0.3040 | -0.0048 | 0.3297 | |||
| (0.3031) | (0.6736) | (0.5043) | ||||
| Household FE | Yes | Yes | Yes | Yes | Yes | Yes |
| Period FE | Yes | Yes | Yes | Yes | Yes | Yes |
| N | 14,666 | 14,666 | 14,666 | 14,666 | 14,666 | 14,666 |
| R² (within) | -0.0030 | -0.0030 | -0.0004 | -0.0004 | -0.0031 | -0.0031 |
| *p<0.1; **p<0.05; ***p<0.01 | ||||||
| Non-religious shocks | Non-religious shocks w/ int. | Negative Shocks | Negative shocks w/ int | Funeral / Death of relative | Funeral / Death of relative w/ int | |
| Shocked (individual) | 0.0657** | 0.0291 | 0.0602 | 0.0316 | 0.0607 | 0.0395 |
| (0.0329) | (0.0525) | (0.0475) | (0.0681) | (0.0413) | (0.0616) | |
| Community shocks / participant | 0.0557 | 0.0180 | 0.2191 | 0.1913 | -0.0673 | -0.0899 |
| (0.1096) | (0.1168) | (0.1654) | (0.1692) | (0.1647) | (0.1702) | |
| Shocked × community shocks / participant | 0.2469 | 0.4022 | 0.2239 | |||
| (0.2844) | (0.6706) | (0.4999) | ||||
| Household FE | Yes | Yes | Yes | Yes | Yes | Yes |
| Period FE | Yes | Yes | Yes | Yes | Yes | Yes |
| N | 14,666 | 14,666 | 14,666 | 14,666 | 14,666 | 14,666 |
| R² (within) | 0.0019 | 0.0019 | 0.0014 | 0.0014 | 0.0002 | 0.0002 |
| *p<0.1; **p<0.05; ***p<0.01 | ||||||
Descriptives on Shocks
Timing of Shocks
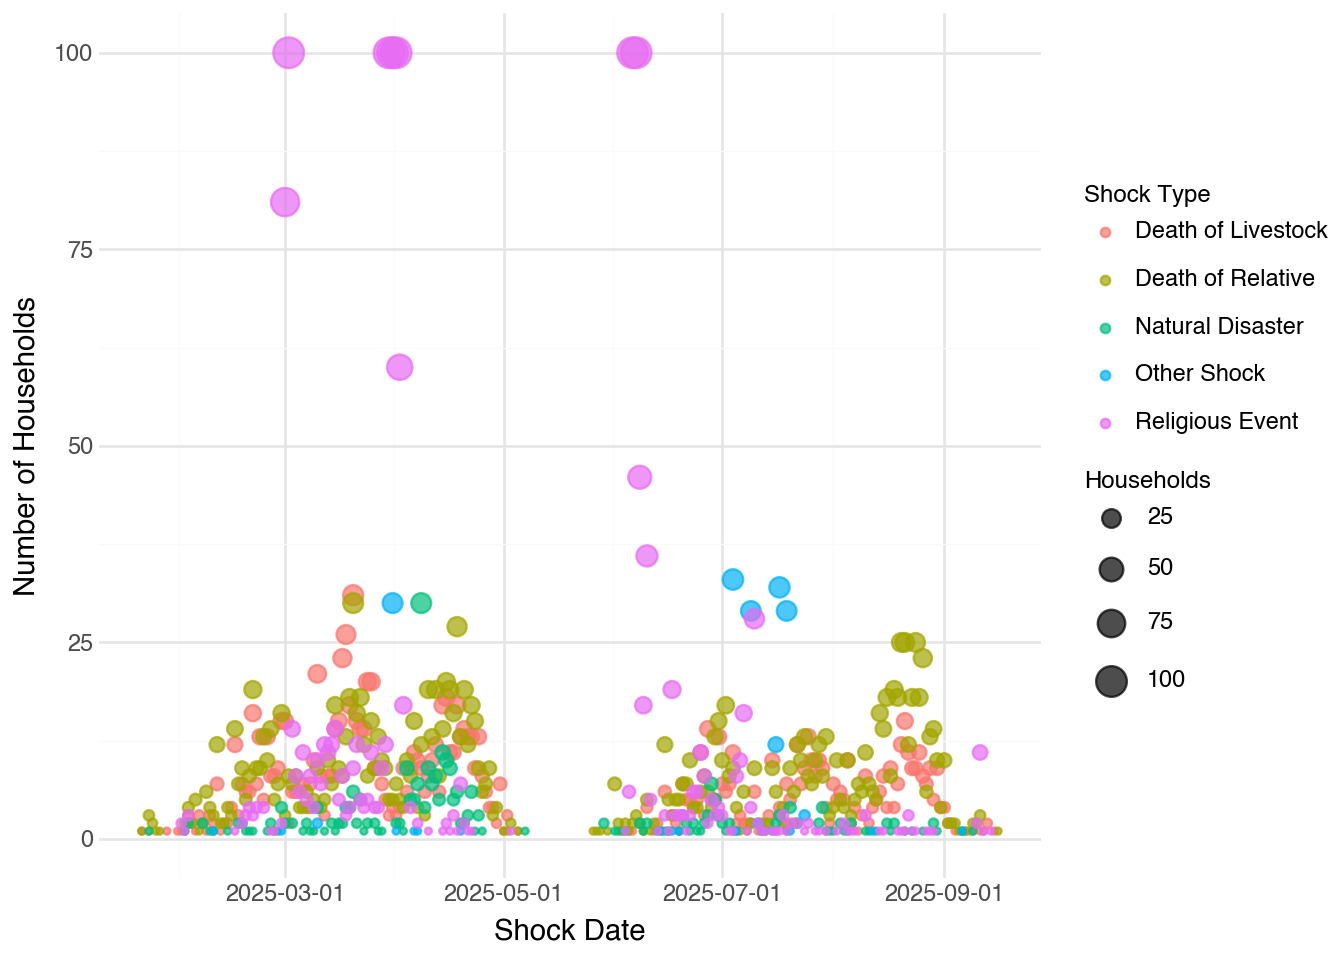
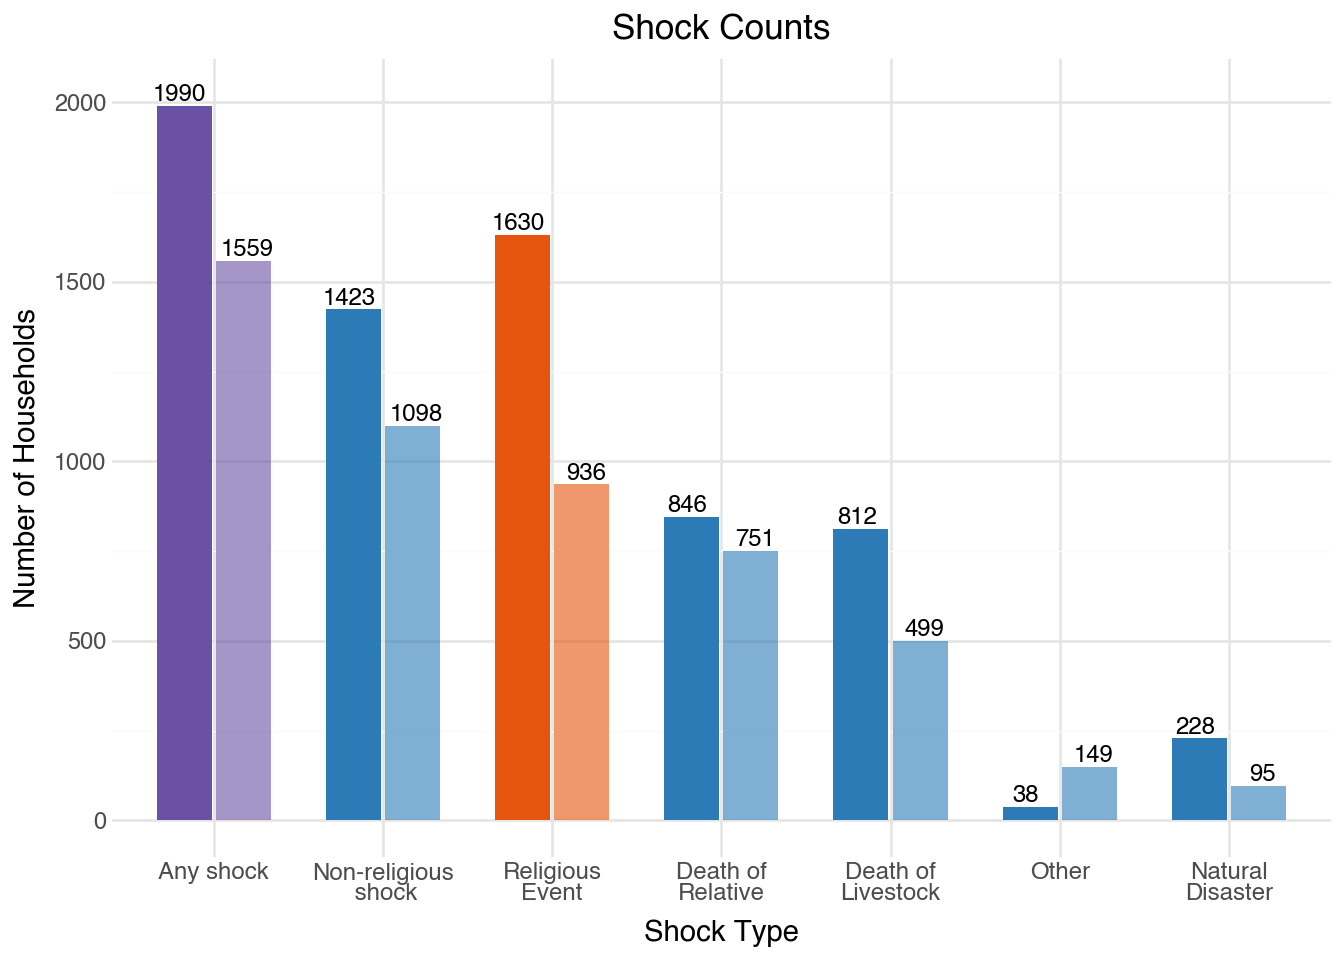
Types of shock we had and counts
Note
Transparent colors indicate endline data
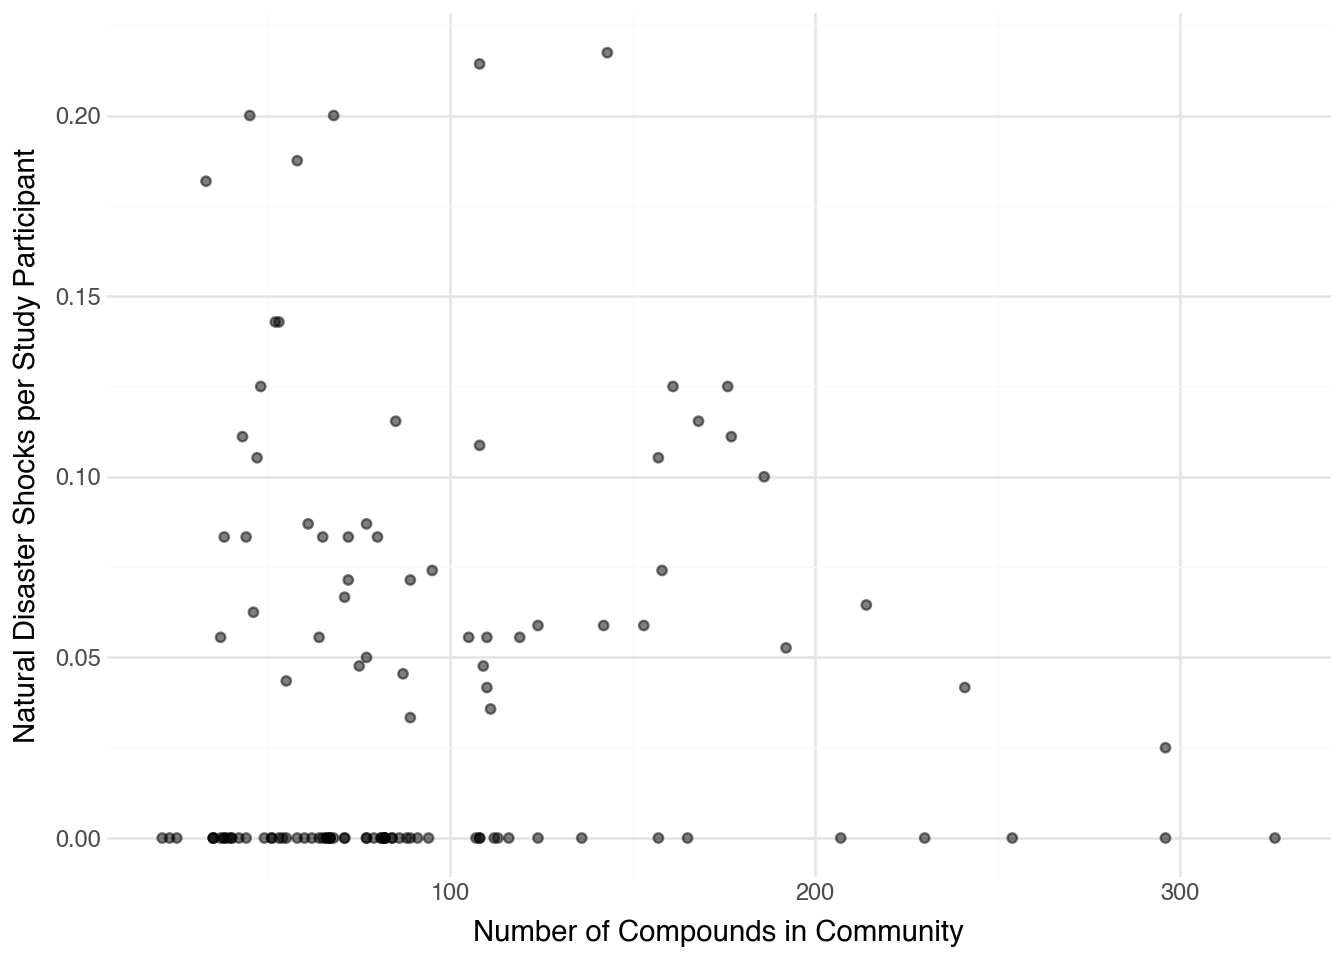
Shocks and Communities - Descriptives
/var/folders/rj/c4rjx52d217gsm3ccfx5q20r0000gr/T/ipykernel_99518/1357806734.py:33: DeprecationWarning: *scattermapbox* is deprecated! Use *scattermap* instead. Learn more at: https://plotly.com/python/mapbox-to-maplibre//var/folders/rj/c4rjx52d217gsm3ccfx5q20r0000gr/T/ipykernel_99518/1357806734.py:33: DeprecationWarning: *scattermapbox* is deprecated! Use *scattermap* instead. Learn more at: https://plotly.com/python/mapbox-to-maplibre//var/folders/rj/c4rjx52d217gsm3ccfx5q20r0000gr/T/ipykernel_99518/1357806734.py:33: DeprecationWarning: *scattermapbox* is deprecated! Use *scattermap* instead. Learn more at: https://plotly.com/python/mapbox-to-maplibre/Appendix
Regressions - Shocks on Mental Health
The below are alternate specs for the main shock regressions with different sets of fixed effects and impact on individual mental health measures.
| Religious Event | Relative Death | Livestock Death | Natural Disaster | Negative shocks | |
| Shock | 0.1170 | -0.1235 | -0.0968 | -0.2061 | -0.1018 |
| (0.0858) | (0.0824) | (0.1080) | (0.3937) | (0.1047) | |
| Household FE | Yes | Yes | Yes | Yes | Yes |
| Period FE | Yes | Yes | Yes | Yes | Yes |
| N | 2,508 | 2,508 | 2,508 | 2,508 | 2,508 |
| R² (within) | 0.0009 | 0.0007 | 0.0004 | 0.0001 | 0.0005 |
| N (positive) | 122 | 95 | 85 | 4 | 89 |
| *p<0.1; **p<0.05; ***p<0.01 | |||||
| Religious Event | Relative Death | Livestock Death | Natural Disaster | Negative shocks | |
| Shock | 0.1308*** | -0.1077*** | -0.0743* | -0.1845** | -0.0850** |
| (0.0346) | (0.0355) | (0.0407) | (0.0792) | (0.0376) | |
| Household FE | Yes | Yes | Yes | Yes | Yes |
| Period FE | Yes | Yes | Yes | Yes | Yes |
| N | 14,666 | 14,666 | 14,666 | 14,666 | 14,666 |
| R² (within) | 0.0078 | 0.0073 | 0.0068 | 0.0069 | 0.0070 |
| N (positive) | 773 | 667 | 440 | 81 | 513 |
| *p<0.1; **p<0.05; ***p<0.01 | |||||
| Religious Event | Relative Death | Livestock Death | Natural Disaster | Negative shocks | |
| Shock | 0.1725*** | -0.1003*** | -0.0742* | -0.1822** | -0.0838** |
| (0.0332) | (0.0345) | (0.0400) | (0.0788) | (0.0369) | |
| Household FE | Yes | Yes | Yes | Yes | Yes |
| Period FE | Yes | Yes | Yes | Yes | Yes |
| N | 14,666 | 14,666 | 14,666 | 14,666 | 14,666 |
| R² (within) | 0.0022 | 0.0007 | 0.0002 | 0.0003 | 0.0003 |
| N (positive) | 773 | 667 | 440 | 81 | 513 |
| *p<0.1; **p<0.05; ***p<0.01 | |||||
| Religious Event | Relative Death | Livestock Death | Natural Disaster | Negative shocks | |
| Shock | 0.0556 | -0.1332*** | -0.0545 | -0.1499 | -0.0654 |
| (0.0409) | (0.0395) | (0.0468) | (0.1022) | (0.0432) | |
| Household FE | Yes | Yes | Yes | Yes | Yes |
| Period FE | Yes | Yes | Yes | Yes | Yes |
| N | 14,666 | 14,666 | 14,666 | 14,666 | 14,666 |
| R² (within) | 0.0006 | -0.0006 | -0.0001 | 0.0002 | -0.0001 |
| N (positive) | 773 | 667 | 440 | 81 | 513 |
| *p<0.1; **p<0.05; ***p<0.01 | |||||
| Religious Event | Relative Death | Livestock Death | Natural Disaster | Negative shocks | |
| Shock | -0.0029 | -0.1460*** | -0.0216 | -0.0703 | -0.0391 |
| (0.0434) | (0.0433) | (0.0539) | (0.1214) | (0.0497) | |
| Household FE | Yes | Yes | Yes | Yes | Yes |
| Period FE | Yes | Yes | Yes | Yes | Yes |
| N | 14,666 | 14,666 | 14,666 | 14,666 | 14,666 |
| R² (within) | -0.0001 | -0.0009 | -0.0001 | 0.0000 | -0.0001 |
| N (positive) | 773 | 667 | 440 | 81 | 513 |
| *p<0.1; **p<0.05; ***p<0.01 | |||||
| Religious Event | Relative Death | Livestock Death | Natural Disaster | Negative shocks | |
| Shock | 0.1109** | -0.0642 | -0.0612 | -0.1662 | -0.0770 |
| (0.0466) | (0.0500) | (0.0576) | (0.1176) | (0.0531) | |
| Household FE | Yes | Yes | Yes | Yes | Yes |
| Period FE | Yes | Yes | Yes | Yes | Yes |
| N | 14,666 | 14,666 | 14,666 | 14,666 | 14,666 |
| R² (within) | 0.0004 | 0.0002 | 0.0002 | 0.0002 | 0.0003 |
| N (positive) | 773 | 667 | 440 | 81 | 513 |
| *p<0.1; **p<0.05; ***p<0.01 | |||||
| Religious Event | Relative Death | Livestock Death | Natural Disaster | Negative shocks | |
| Shock | 0.0785* | -0.1063** | -0.0864 | 0.0307 | -0.0680 |
| (0.0461) | (0.0448) | (0.0534) | (0.1302) | (0.0503) | |
| Household FE | Yes | Yes | Yes | Yes | Yes |
| Period FE | Yes | Yes | Yes | Yes | Yes |
| N | 14,666 | 14,666 | 14,666 | 14,666 | 14,666 |
| R² (within) | 0.0011 | -0.0003 | 0.0000 | 0.0000 | 0.0000 |
| N (positive) | 773 | 667 | 440 | 81 | 513 |
| *p<0.1; **p<0.05; ***p<0.01 | |||||
| Religious Event | Relative Death | Livestock Death | Natural Disaster | Negative shocks | |
| Shock | -0.0575 | 0.0595 | 0.0645 | 0.1784 | 0.0641 |
| (0.0441) | (0.0412) | (0.0508) | (0.1183) | (0.0474) | |
| Household FE | Yes | Yes | Yes | Yes | Yes |
| Period FE | Yes | Yes | Yes | Yes | Yes |
| N | 14,666 | 14,666 | 14,666 | 14,666 | 14,666 |
| R² (within) | 0.0004 | 0.0008 | 0.0004 | 0.0002 | 0.0005 |
| N (positive) | 773 | 667 | 440 | 81 | 513 |
| *p<0.1; **p<0.05; ***p<0.01 | |||||
Community Shocks Predicting Individual Shocks
| Non-religious shocks | Negative shocks | Death of relative | |
| Shock in Community (Yes / No) | 0.0905*** | 0.0734*** | 0.0756*** |
| (0.0052) | (0.0039) | (0.0042) | |
| Household FE | Yes | Yes | Yes |
| Period FE | Yes | Yes | Yes |
| N | 14,666 | 14,666 | 14,666 |
| R² (within) | 0.0425 | 0.0452 | 0.0451 |
| *p<0.1; **p<0.05; ***p<0.01 | |||
Baseline Shock Reports
| shock_type_label | Livestock Death | Natural Disaster | Other | Relative Death | Religious Event |
|---|---|---|---|---|---|
| treatment | |||||
| Control | 141 | 41 | 8 | 137 | 283 |
| Predictable | 145 | 49 | 7 | 154 | 294 |
| Stable | 139 | 38 | 5 | 150 | 273 |
| Unpredictable | 387 | 100 | 18 | 405 | 780 |
Endline Shock Reports
| shock_type_label | Livestock Death | Natural Disaster | Other | Relative Death | Religious Event |
|---|---|---|---|---|---|
| treatment | |||||
| Control | 96 | 8 | 17 | 121 | 168 |
| Predictable | 92 | 15 | 31 | 125 | 159 |
| Stable | 75 | 21 | 27 | 142 | 171 |
| Unpredictable | 236 | 51 | 74 | 363 | 438 |